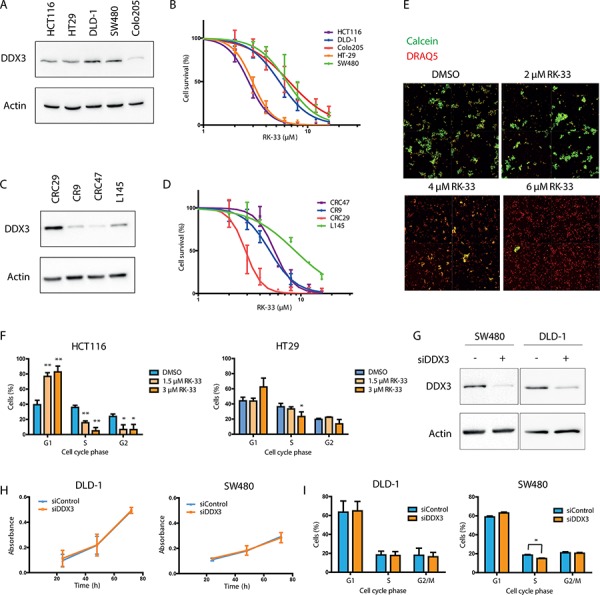
Figure 4. RK-33 sensitivity in colorectal cancer cell lines.

A. Immunoblot showing the relative DDX3 expression in adherent colorectal cancer cell lines. B. MTS assay showing cytoxicity of RK-33 in different colorectal cancer cell lines. C. Immunoblot showing the relative DDX3 expression in patient-derived 3D cultures. D. Cytotoxicity assay showing the sensitivity of patient-derived 3D cultures of colorectal cancer. E. Example of cytotoxicity assay with RK-33 in CRC29 3D cultures. The DRAQ5 positive (red) areas are used to determine the outline of the spheroids. The Calcein AM (green) intensity within this area is used as a measure for living cells. F. Cell cycle analysis after DDX3 inhibition with increasing concentrations RK-33 in HCT116 and HT29 G. Immunoblots of DDX3 expression in colorectal cancer cell lines SW480 and DLD-1 before and after inhibition of DDX3 with 50 nM siDDX3. H. Proliferation of Colorectal cancer cell lines SW480 and DLD-1 after knockdown of DDX3, measured by daily MTS assays. I. Cell cycle analysis after knockdown of DDX3 in SW480 and DLD-1. All experiments were performed three independent times, graphs represent mean ± SD, *p < 0.05, **p < 0.01
