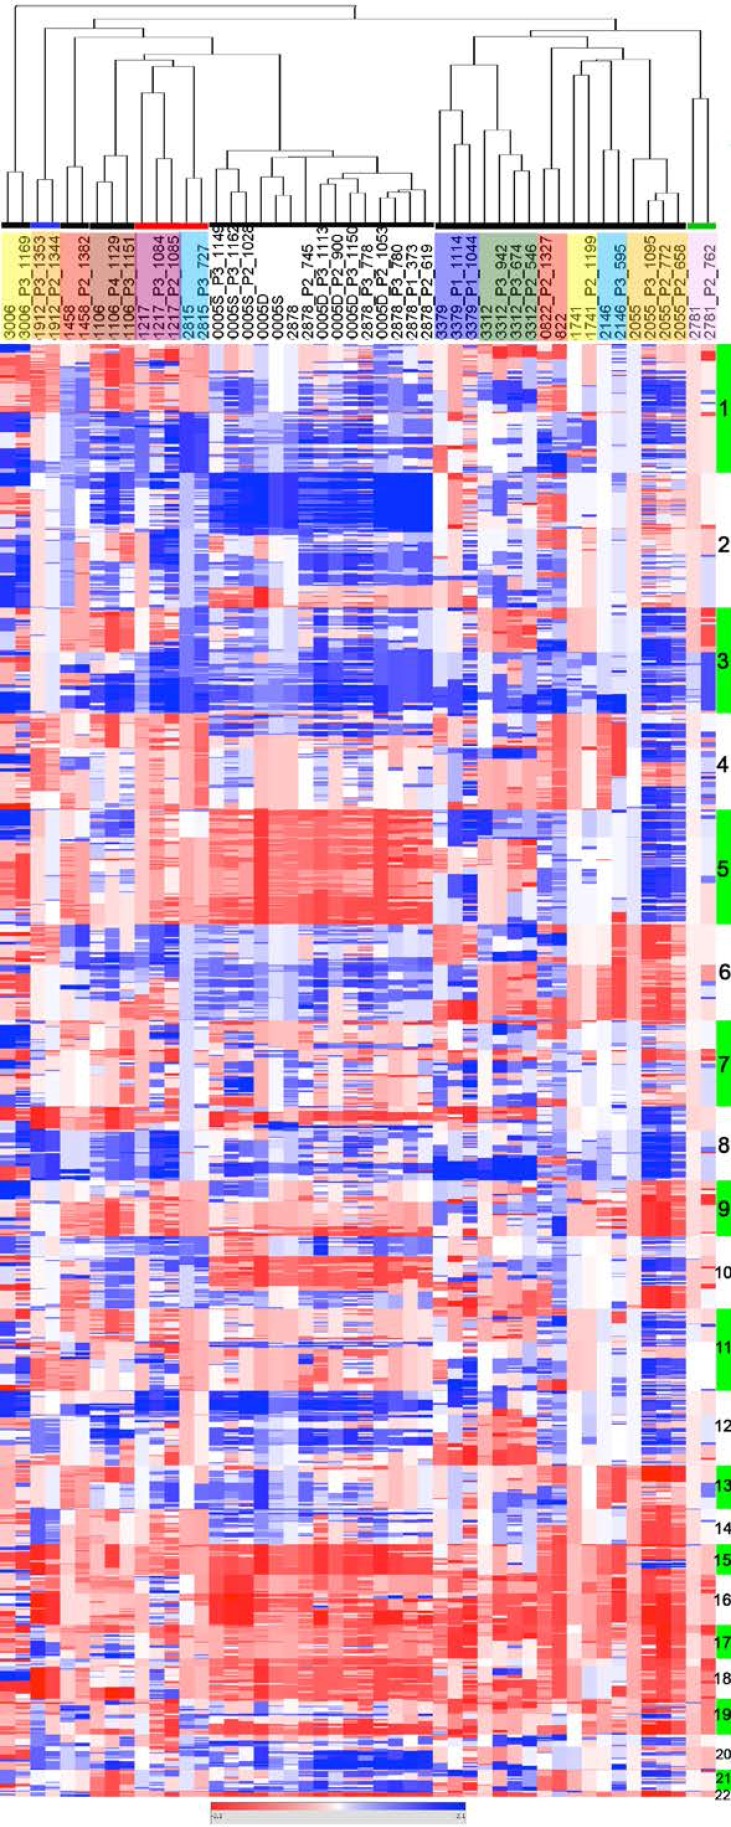
Figure 2. EOC of origin and corresponding PDXs show similar CNC profiles.
CNC profiles of patient tumors and corresponding PDXs were analyzed by unsupervised hierarchical clustering showing systematic co-clustering. When several PDXs generated from the same original tumor could be analyzed they regrouped as tight clusters. Samples are in columns, chromosomal localization in rows. Chromosomes are indicated as alternating green and white vertical bars and identified by their number. Each family of EOC and derived PDXs are highlighted in colored boxes below the dendogram (no code associated to the colors used). Colored horizontal lines indicate the histological type of the EOC grafted; black: serous ovarian carcinoma, blue: clear cell carcinoma, red: carcino-sarcoma, green; mucinous carcinoma.

