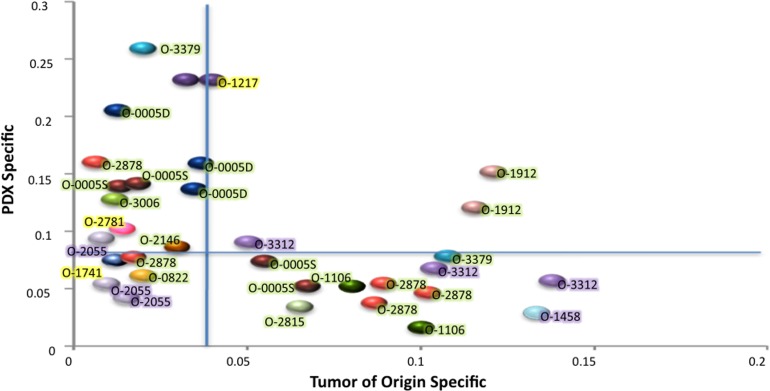
Figure 3. Fraction of the genome involved in CNCs differing in the PDX as compared with cognate patient EOC.
The X axis represents CNC originally present in the patient tumor and absent in the PDX (Tumor of origin specific), the Y axis CNCs occurring de novo in the PDX while not scored in the tumor of origin (PDX specific). Vertical and horizontal blue lines indicate the median levels of tumor specific (X) or PDX specific (Y) CNCs. Each color ball represents the comparison of the tumor of origin and one PDX. Tumors occurring only once in the graph are those where only one PDX was analyzed. Tumor IDs are indicated and color highlights indicate the fraction of tumor cells for each tumor of origin; green 70 to 90%, purple 50 to 70%, yellow < 50%.

