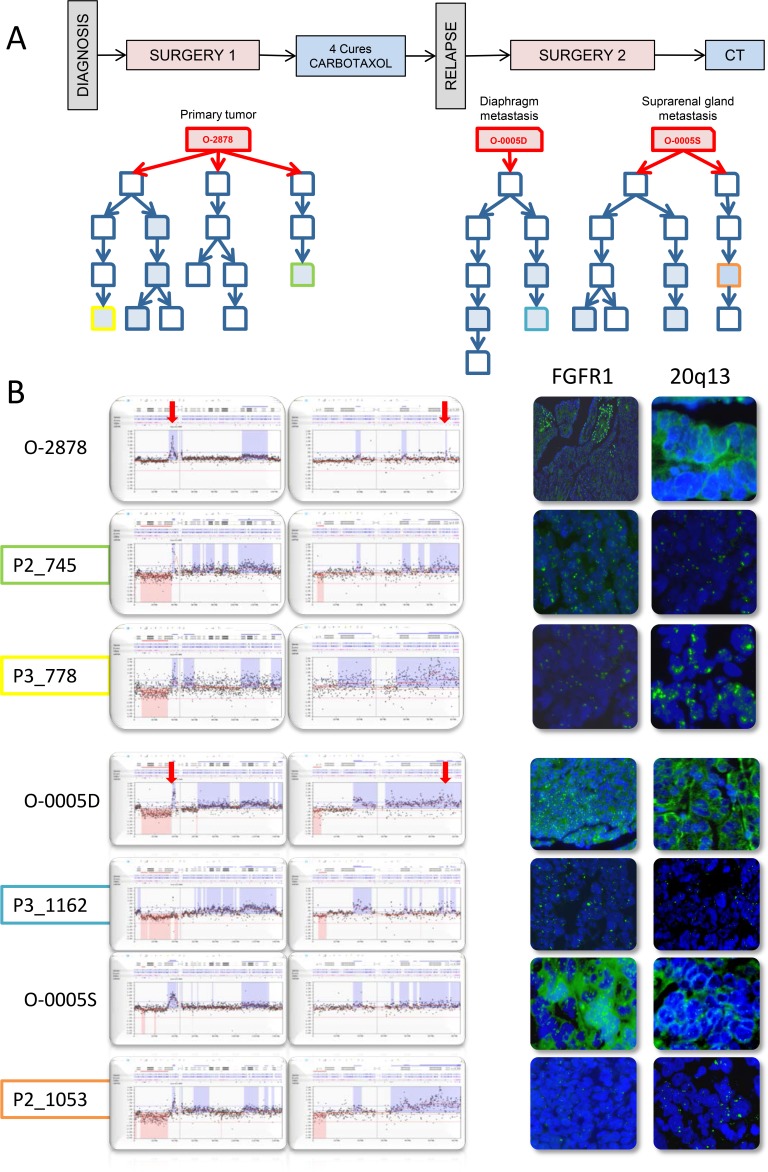
Figure 4. PDX established from tumor O-2878 and subsequent metastatic recurrences O-0005D and O-0005S show fluctuating CNC patterns at 8p12 and 20q13 indicating oligoclonality.
A. Schematic representation of the clinical history of patient 2878 and graft trees of the PDXs established from the 3 original tumors. Each represents a PDX. Boxes in blue filling correspond to cases that were analyzed by array-CGH, color lining identifies PDXs presented in B. B. zoomed representations of array-CGH profiles at chromosomes 8p12 (left box) and 20q13 (right box) showing variation in copy number levels as well as in the size of the region of gain. Variations observed by array-CGH were confirmed by interphase FISH on frozen tumor sections using probes to FGFR1 (8p12) and an anonymous probe to 20q13.

