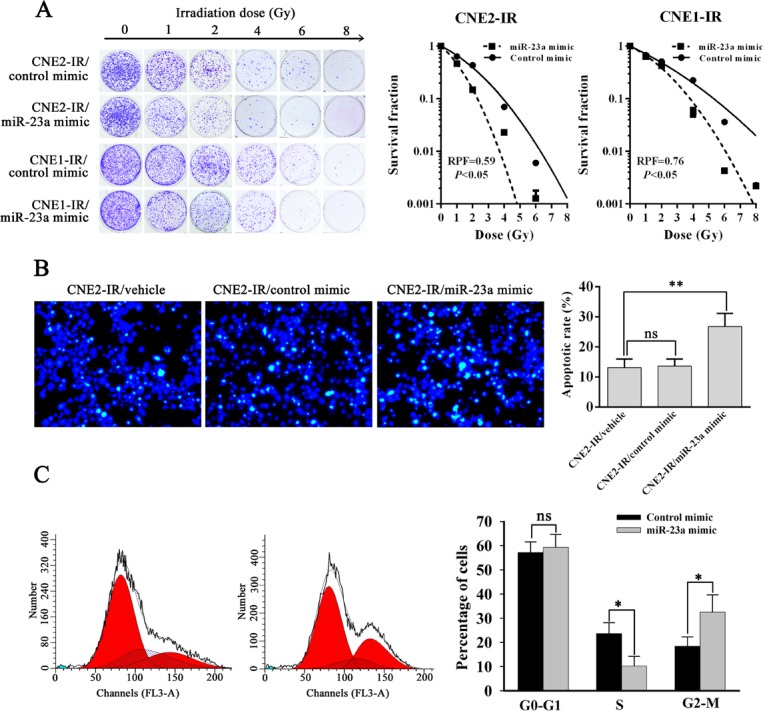
Figure 2. MiR-23a decreases NPC cell radioresistance in vitro.

A., a clonogenic survival assay shows that transfection of miR-23a mimic decreased NPC cell radioresistance compared with transfection of control mimic. (left) CNE2-IR and CNE1-IR cells transiently transfected with control or miR-23a mimic were irradiated with a range of 1-8Gy radiation doses, and colonies that formed after incubation of 12d were stained with crystal violet and photographed; (middle and right) dose survival curves in the CNE2-IR (middle) and CNE1-IR cells (right) transiently transfected with control or miR-23a mimic were created by fitting surviving fractions to the linear quadratic equation. B., Hoechst 33258 staining shows that transfection of miR-23a mimic increased the apoptosis of irradiation-induced CNE2-IR cells compared with transfection of control mimic. (left) CNE2-IR and CNE2-IR cells transiently transfected with control or miR-23a mimic were exposed to 6 Gy irradiation, incubated for 72h, stained with Hoechst 33258 and photographed; (right) a histogram shows the apoptotic rate of CNE2-IR cells and its transfectants. C., a flow cytometry analysis of cell cycle shows that miR-23a mimic-transfected CNE2-IR cells were blocked at G2-M phase by ionizing radiation. (left) a representative result of cell cycle distribution of control or miR-23a mimic-transfected CNE2-IR cells at 24h after 6 Gy irradiation. (right) a histogram shows percentages of cells at each cycle phase in the control or miR-23a mimic-transfected CNE2-IR cells. Three experiments were done; Means, SDs, and statistical significance are denoted; *, P < 0.05; **, P < 0.05; ns, nonsignificant difference.
