
Figure 3. MiR-23a decreases NPC cell radioresistance in vivo.
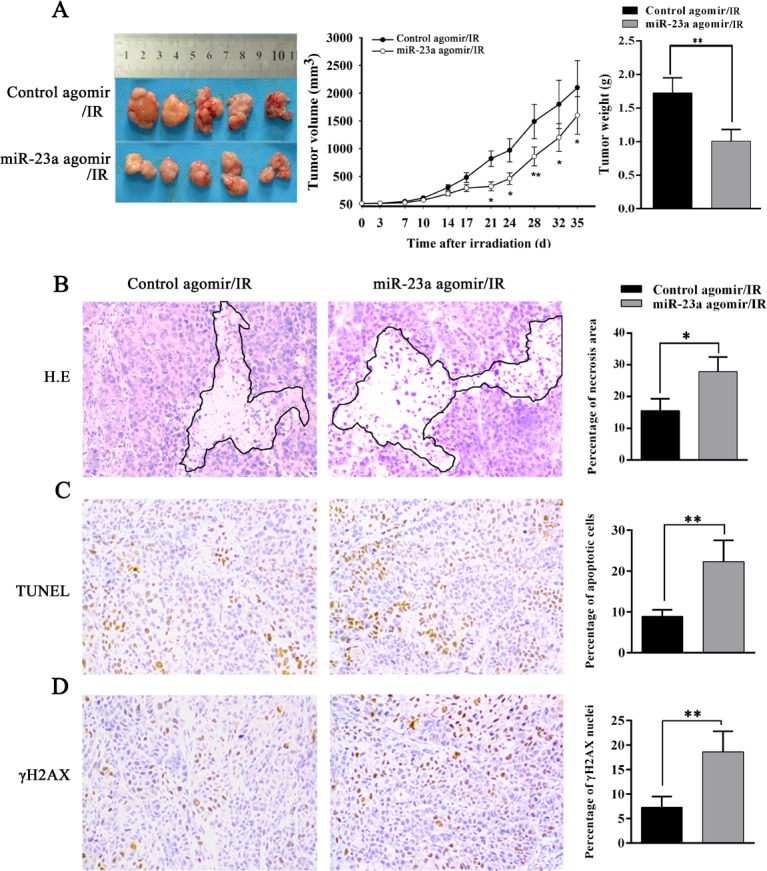
A., the growth and weight of control or miR-23a agomir-injected CNE2-IR xenograft tumors after irradiation. (left) 5 nmol control or miR-23a agomir was injected into CNE2-IR xenografts before and after 8 Gy ionizing radiation. 5 weeks after irradiation, the mice were killed, and the tumors were photographed; (middle) the growth curves of control or miR-23a agomir-injected CNE2-IR tumors (n = 5 each group) at the sacrifice with respect to the first measurements after irradiation; (right) the average weights of control or miR-23a agomir-injected CNE2-IR tumors (n = 5 each group) at the sacrifice. B., (left) a representative image of H&E staining of control or miR-23a agomir-injected CNE2-IR tumors with regions of necrosis outlined after irradiation; (right) a histogram shows percentages of necrosis areas in the tumors (n = 5 each group). C., (left) a representative image of TUNEL detection of apoptotic cells in the control or miR-23a agomir-injected CNE2-IR tumors after irradiation; (right) a histogram shows percentages of apoptotic cells in the tumors (n = 5 each group). D., (left) a representative image of immunohistochemical staining for γH2AX in the control or miR-23a agomir-injected CNE2-IR tumors after irradiation; (right) a histogram shows percentages of γ-H2AX positive cells in the tumors (n = 5 each group). Means, SDs, and statistical significance are denoted; *, P < 0.05; **, P < 0.01. Original magnification, ×200.