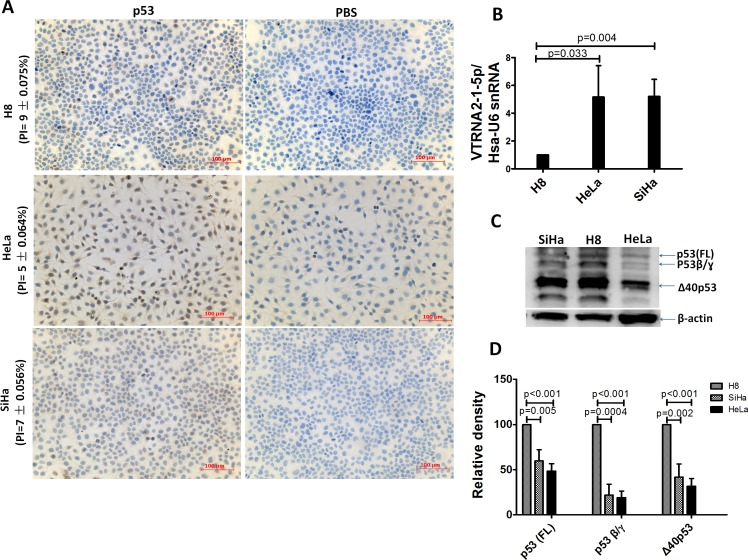
Figure 3. Comparison of VTRNA2-1-5p expression in three cervical cell lines with low p53 expression.
A. Low p53 expression assessed by IHC in H8, HeLa, and SiHa cell lines (n = 6, Supplementary Table 3). B. Overexpression of VTRNA2-1-5p in SiHa and HeLa cells; under-expression of VTRNA2-1-5p in H8 cells is shown by real-time stem-loop RT-PCR. The results represent the mean±SD of at least 3 independent experiments. C. Three wild-type p53 isoforms (FLp53, p53β and Δ40p53) were detected in the three cell lines by Western blotting. D. Statistical graph showing p53 isoform expression in three cell lines. Under identical levels of total protein (50 μg), p53 isoform expression in HeLa was lower than that in SiHa or H8 cells (n = 3).

