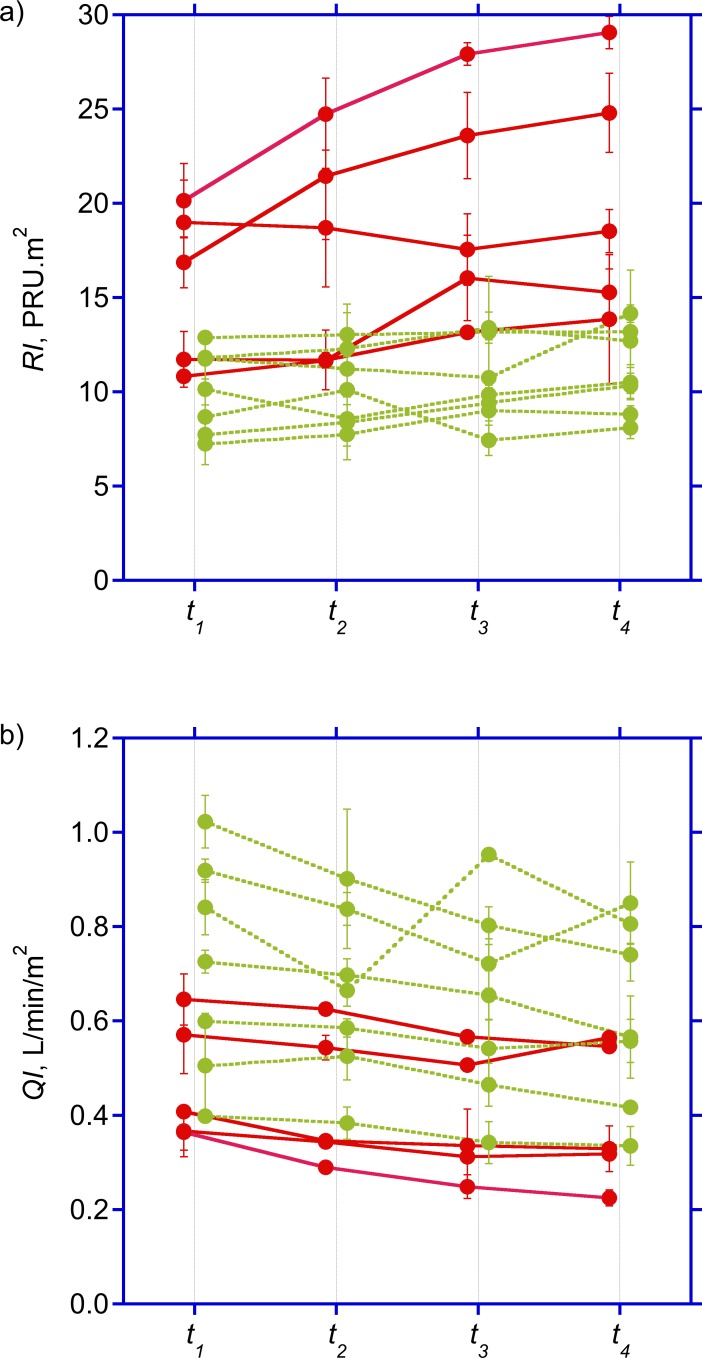
Fig 2. Time course of hepato-splanchnic hemodynamics.
Time course of splanchnic vascular resistance index (RI) (top panel) and hepato-splanchnic perfusion index (QI) (bottom panel) measured at times t 1 through t 4 during dialysis in diabetic (red symbols) and non-diabetic (green symbols) subjects. Symbols represent average values ± standard deviations of duplicate measurements obtained in treatments separated by one week. For clarity, symbols for diabetics and non-diabetics are placed with a small left or right offset from the actual measuring times.

