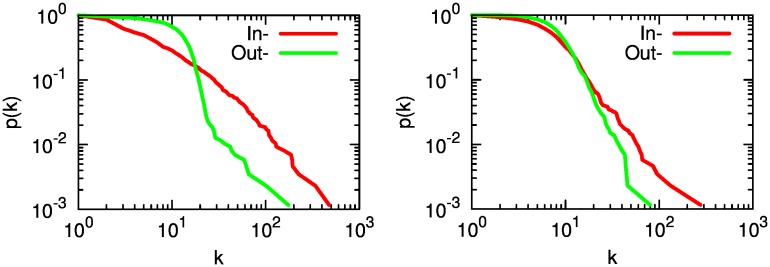
Fig 3. The call-based (left) and mobility (right) degree distributions.
Cumulative indegree (red) and outdegree (green) distributions for the call and mobility networks. The plots report the probability that a node in each network has a given degree, or higher. For instance, in the call network there is roughly a 1% probability (p(k) = 10−2) that a node has a indegree of 100 (k = 102) or more.

