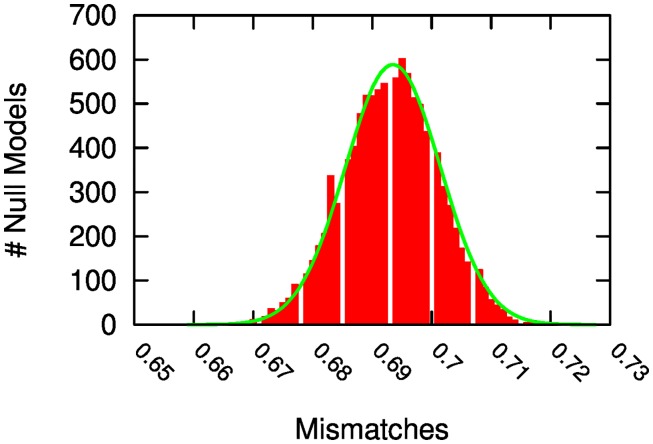
Fig 6. Null model mismatch distribution.
We calculate null call-based and mobility community and we test their degree of overlap. The figure reports the number of null models (Y axis) scoring each overlap value interval (X axis). The visible white bands are caused by gaps in the possible overlap values that we can obtain, since the denominator is lower than 1,000 (it is equal to the number of nodes, n = 863). Green line fits the most likely probability distribution, which is a Gaussian with μ = 0.7287 and σ = 0.0074.

