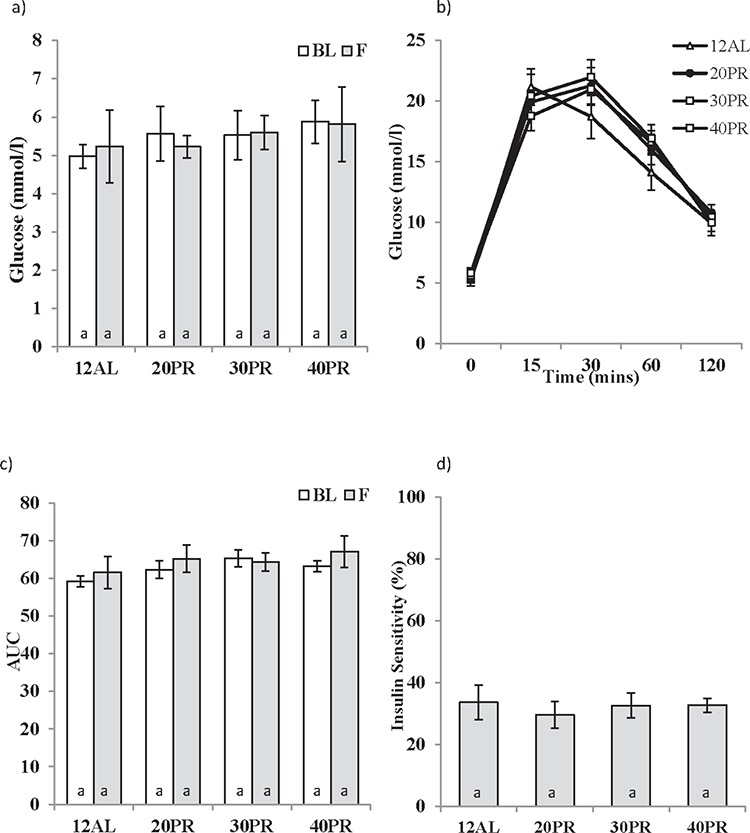
Figure 10. The effect of graded levels of protein restriction (PR) on glucose homeostasis.

a. Fasting glucose concentrations at baseline (BL) and following 3 months of PR (F). 20PR, 30PR and 40PR represent 20%, 30% and 40% PR. Control groups were fed ad libitum (AL) for 12 hrs (12AL). b. Glucose concentrations following glucose injection measured after 3 months graded PR, c. glucose tolerance calculated as area under the curve (AUC) and d. insulin sensitivity estimated from the homeostatic assessment model (HOMA2). Different letters within a time point indicate significant differences between groups. Data represented as mean ± sem. Results are shown on the same axis as Figure 2.
