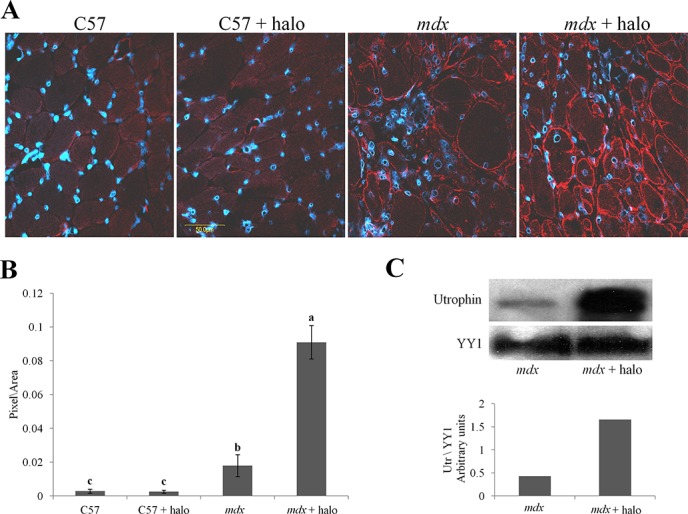
Figure 3. Utrophin levels in the diaphragms of mdx mice.

A. Mice (mdx or C57/Bl; n = 6/group) were injected IP with either halofuginone at 7.5 μg per mouse or with saline, for 10 weeks starting from the age of 4 weeks. The diaphragms were immunostained with utrophin antibodies (red) and nuclei with DAPI (blue), and visualized by confocal microscopy. B. Image analysis quantification of utrophin levels presented as mean pixels/unit area ± SE of the whole diaphragms of at least 6 mice/group. Means with no common superscript differ significantly (p < 0.05). C. Western blots analysis of utrophin in the mdx diaphragm (pool of three diaphragms in each group).
