
Figure 2. Copy number analysis of the selected genomic regions in a representative lung cancer sample.
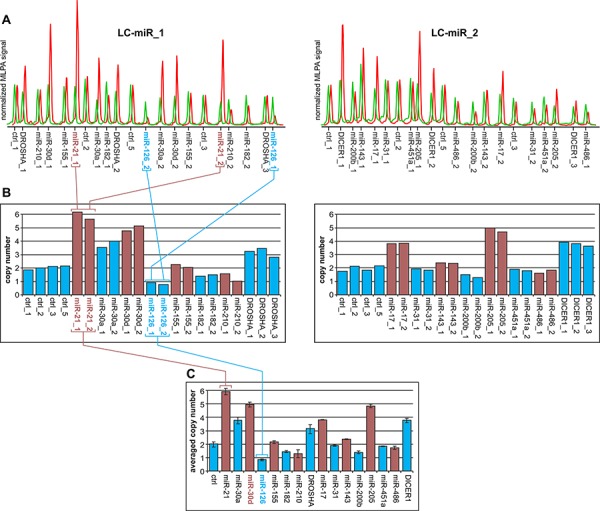
A. Electropherograms of MLPA results obtained with the use of LC-miR_1 (left-hand) and LC-miR_2 (right-hand) MLPA assays. The electropherograms of the cancer sample (red) are presented along the electropherograms from a reference non-cancer sample (green) and normalized against the signal of control probes. Probe IDs are indicated below the electropherograms. The probe signals (peak heights) correspond to the copy number of targeted regions. B. Bar plots (corresponding to the electropherograms of the cancer sample shown above (A)) represent the copy number value (y-axis) of each probe (x-axis) normalized by comparison of its signal in cancer samples to the corresponding signal in reference sample. The colors were used purely for sake of visualization purposes to better distinguish probes of subsequent genomic regions. Note that the signals of probes specific to the same genomic region are synchronized (e.g., probes miR-21_1 and miR-21_1 or miR-126_1 and miR-126_2; indicated in panels A and B). C. Bar plot representing the average copy number values of investigated regions in analyzed samples. Whiskers indicate maximum and minimum copy number values detected in particular regions, as shown in panel B. Note that genomic regions in which the difference between the maximum and minimum signal was higher than one-third of an average copy number value were excluded from further analysis (miR-210).