
Figure 3. Graphical summary of the copy number variation of the analyzed genes in NSCLC samples.
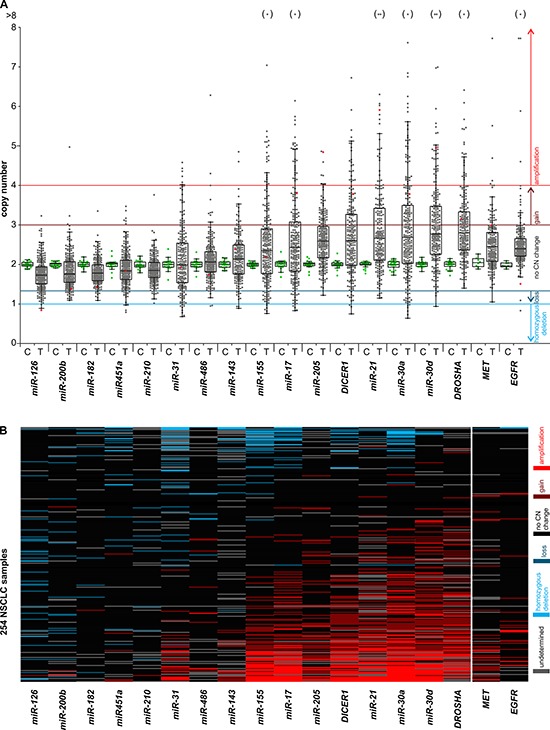
The graph shows the results of copy number analysis of the selected miRNA and miRNA biogenesis genes as well as two lung cancer related oncogenes, MET and EGFR. A. The graph shows the relative copy number values (y-axis) of selected genes (x-axis) of all studied samples. The genes were ordered from the lowest to highest median copy number value. Each dot represents the copy number value of individual control (C – green dot) or lung cancer (T – grey dot) samples. Red dots indicate copy number values of the representative lung cancer sample, analysis of which is shown in Figure 2. Dots in brackets (above) indicate samples with a copy number value >8. Color lines represent threshold values of homozygous deletions, losses, gains and amplifications. The outlined Tukey box-and-whisker plots indicate 1st quartile, median and 3rd quartile, and summarize the distribution of the presented copy number values. B. The heatmap graph showing the distribution of copy number categories of analyzed genes (columns) in 254 lung cancer samples (rows). The genes (from the left) and samples (from the top) were ordered from the lowest to highest average copy number value. Copy number categories are indicated by colors as shown in the legend on the right.