
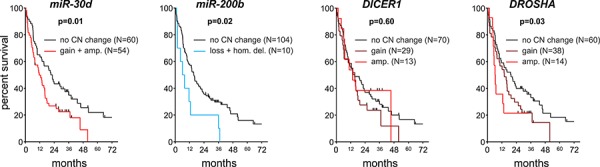
Figure 5. Survival analysis of NSCLC patients.
Kaplan-Meier graphs presents the survival of patients stratified based on copy number categories of (from the left) miR-30d, miR-200b, DICER1 and DROSHA.
Official websites use .gov
A
.gov website belongs to an official
government organization in the United States.
Secure .gov websites use HTTPS
A lock (
) or https:// means you've safely
connected to the .gov website. Share sensitive
information only on official, secure websites.
Kaplan-Meier graphs presents the survival of patients stratified based on copy number categories of (from the left) miR-30d, miR-200b, DICER1 and DROSHA.