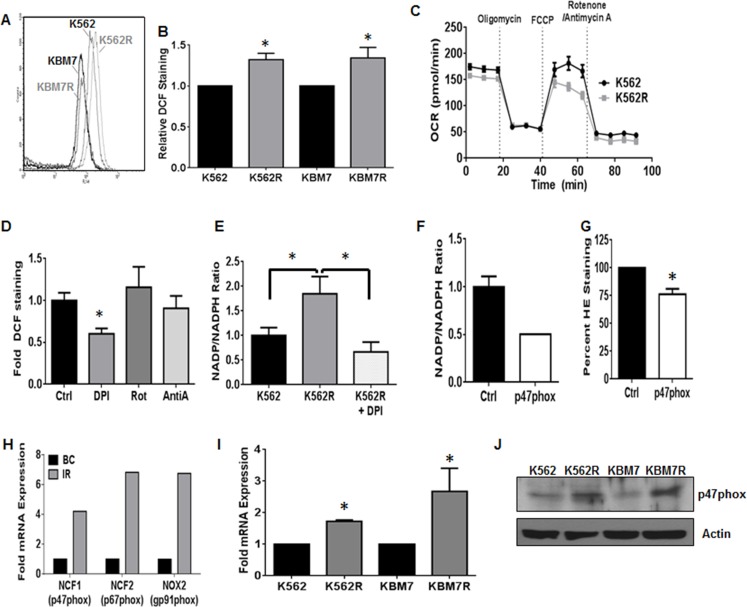
Figure 1. NOX2 promotes increased ROS in TKI-resistant CML.
TKI-sensitive (K562/KBM7) and resistant (K562R/KBM7R) cell lines were harvested and stained for ROS using DCF as described. A representative histogram is shown in A., and staining quantified in B.. Bars are indicative of mean and SEM. * indicates p < 0.05. C. K562 and K562R cells were immobilized using Cell-Tak, and then oxygen consumption rates (OCR) measured over time with indicated treatments by Seahorse Bioanalyzer. All injections were 1 μM. D. Intracellular ROS levels were measured by flow cytometry using DCF staining as described after treatment with 30 μM DPI, 1 μM Rotenone, or 20 μM Antimycin A for 4 hours. Mean fluorescence intensity was normalized to control for each experiment. Bars indicate mean and SEM. * indicates p < 0.05 Unstained cells were utilized as a negative staining control. E. K562 (black bar) and K562R (grey bar) cells were plated at a density of 5×10⁵ cells and grown or treated with 30 μM diphenyleneiodonium (white spotted bar) for 4 hours. Cells were then lysed by freeze/thaw and lysates subjected to NOX activity assay as described. Bars indicate mean and SEM. * indicates p < 0.05. F. 72 hours post transfection with control (black bar) or p47phox (white bar) siRNA, NOX activity levels were measured in K562R cells as described. Bars indicate mean and SEM G. 72 hours post transfection with control (black bar) or p47phox (white bar) siRNA, superoxide levels were measured in K562R cells using HE staining as described. Mean fluorescence intensity was normalized to control for each experiment. Bars indicate mean and SEM. * indicates p < 0.05 Unstained cells were utilized as a negative staining control. H. Microarray data were mined [41] comparing TKI- resistant patients (IR, gray bar, n = 15) to blast crisis (BC, black bar, n = 28). Log (ratio) values were converted to ratios then normalized to blast crisis. I. TKI-sensitive (K562/KBM7) and -resistant (K562R/KBM7R) cell lines were harvested and cDNA made. qRTPCR was performed using p47phox directed primers. Bars indicate mean and SEM. * indicates p < 0.05. J. TKI-sensitive (K562/KBM7) and -resistant (K562R/KBM7R) cell lines were harvested and lysates subjected to SDS-PAGE followed by western blotting using p47phox and Actin antibodies. All data are representative of at least three individual experiments.

