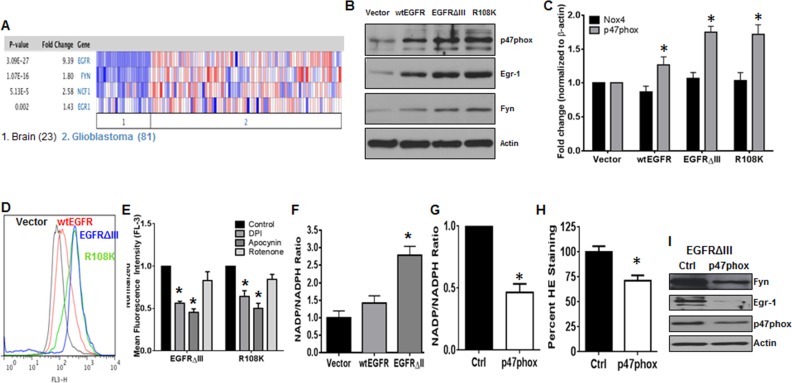
Figure 5. The NOX2/Egr-1/Fyn pathway is active in EGFR-mutated GBM.
A. Data were mined from Sun and colleagues [75] using Oncomine. The number 1 indicates normal brain tissues and the number 2 indicates GBMs. B. The U87 cell line model system expressing vector, wtEGFR, EGFRΔIII, or R108K-EGFR (R108K) were lysed then subjected to SDS-PAGE followed by immunoblotting for p47phox, Egr-1, Fyn, and Actin. C. The panel of U87 cell lines were lysed then subjected to qRTPCR using primers directed against NOX4 or p47phox. Bars indicate mean and SEM. * indicates p < 0.01. D. U87-vector, wtEGFR, EGFRΔIII or R108K cell lines were stained with HE then analyzed by flow cytometry on the FL-3 channel. Representative histograms are displayed. E. EGFRΔIII or R108K expressing U87 cell lines were treated with control, DPI (5 μM; 4 h), apocynin (100 μM; 24 h) or rotenone (1 μM; 4 h). Following treatment, intracellular ROS levels were measured by HE staining then analyzed by flow cytometry. F. NOX activity was measured in vector, wtEGFR, and EGFRΔIII-expressing U87 cells as described. Bars indicate mean and SEM. * indicates p < 0.05. U87-EGFRΔIII cells were transfected with control (black bar) or p47phox (white bar) siRNA. Forty-eight hours post-transfection, G. NOX activity and H. ROS levels were measured as described in materials and methods. Bars indicate mean and SEM. * indicates p < 0.05. I. U87-EGFRΔIII cells were transfected with either control or p47phox siRNA then harvested at 48h and subjected to SDS-PAGE followed by immunoblotting for p47phox, Egr-1, Fyn, and Actin. All data are representative of at least three individual experiments.

