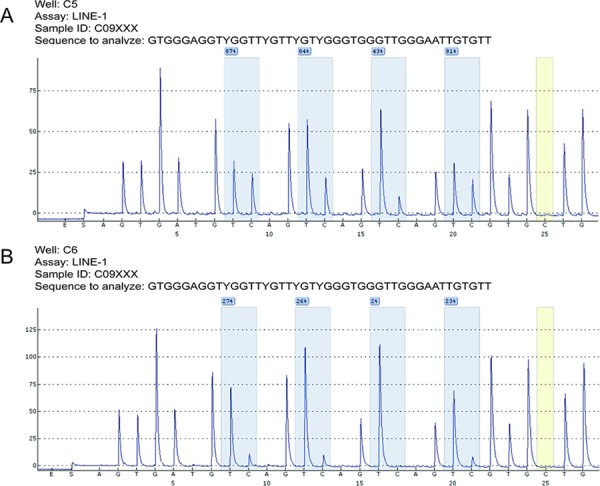
Figure 1. Representative LMR results after pyrosequencing.

Bisulfite-treated DNA samples from adjacent normal mucosa were subjected to PCR amplification and were quantitatively analyzed by pyrosequencing. The C base marked in yellow served as a quality control of the bisulfite conversion efficiency. Four analyzed CpG sites are highlighted in blue, and the percent methylation rate is provided for each site. The mean percentage was computed as the LINE-1 methylation rate (LMR) for each case. Two cases with relatively higher (73.8%, A.) or lower (19.4%, B.) LMR were shown, respectively.
