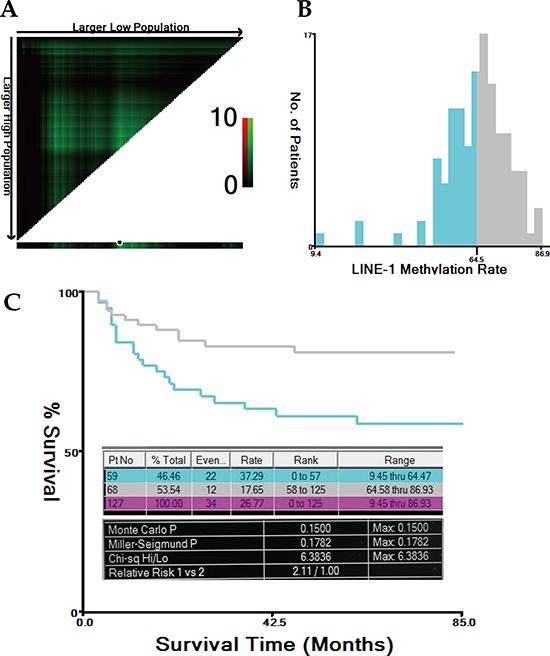
Figure 2. Cutoff value for LMR calculated using the X-tile program.

The X-tile program was utilized to calculate the optimal cutoff value for the LINE-1 methylation rate (LMR). Based on the patient survival data, the entire population was divided into the training and validation sets. The training set is shown in the upper-left quartile, with plots of the matched validation set in the small long strip (on the bottom X-axis). The black dot in the validation set represents the exact cutoff value for the LMR (A). The entire cohort was divided into low (blue) or high (grey) LMR groups based on the cutoff value (64.47%), as shown in the histogram (B). Kaplan-Meier plots were generated based on this cutoff value. The detailed outputs of the X-tile analysis are presented (maximum high/low x2 = 6.38, Monte Carlo P = 0.15) (C).
