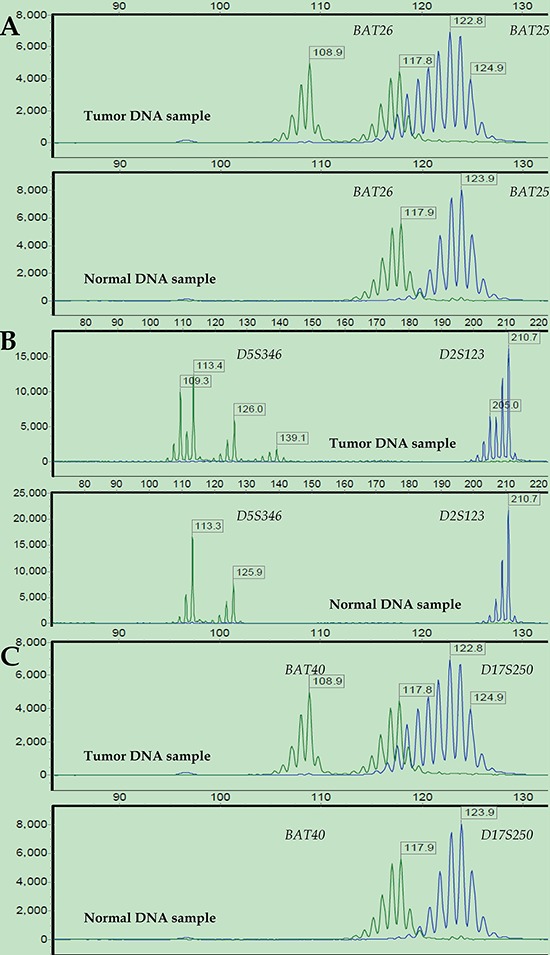
Figure 3. Representative MSI status results after STR analysis.

Electropherograms of labeled PCR products targeting six microsatellite loci in paired tumor (upper) and normal (bottom) DNA samples from a representative patient: BAT26 and BAT25 (A), D5S346 and D2S123 (B), and BAT40 and D17S250 (C). The PCR product size is represented on the X-axis, and fluorescence units are represented on the Y-axis. For all the microsatellite loci, the tumor DNA sample showed altered allelic profiles compared to the matched normal DNA sample. Thus, this case was defined as MSI-H.
