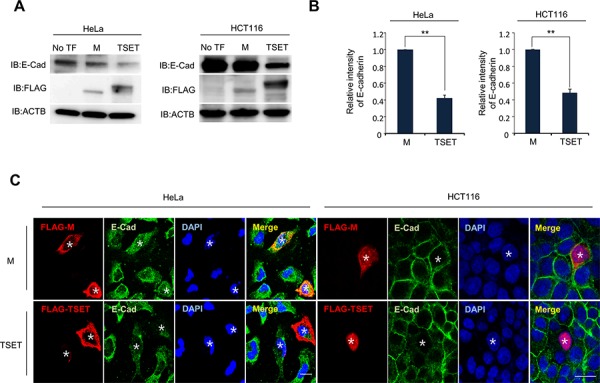
Figure 2. TSET represses the expression of E-cadherin in cancer cells.

A. Expression levels of E-cadherin in HeLa and HCT116 cells. FLAG-M and FLAG-TSET vectors were transfected into HeLa and HCT116 cells for 48 h, respectively. Western blot was performed to measure E-cadherin expression level, and anti-ACTB antibody was used as an internal control (No TF: No Transfection). B. Quantitative real-time PCR analysis showing suppression of E-cadherin expression by TSET. Relative mRNA expression shows the value normalized to the expression level of ACTB (P values were calculated using Student's t test **p < 0.01). C. Immunocytochemistry showed that the expression of E-cadherin was repressed by TSET. After transfection of FLAG-TSET or FLAG-M into HeLa and HCT116 cells, the cells were fixed with methanol. The fixed cells were stained with anti-E-cadherin (Alexa Fluor 488 [green]) or anti-FLAG (Alexa Fluor 594 [red]) antibodies and DAPI (blue) (*: Transfected Cell).
