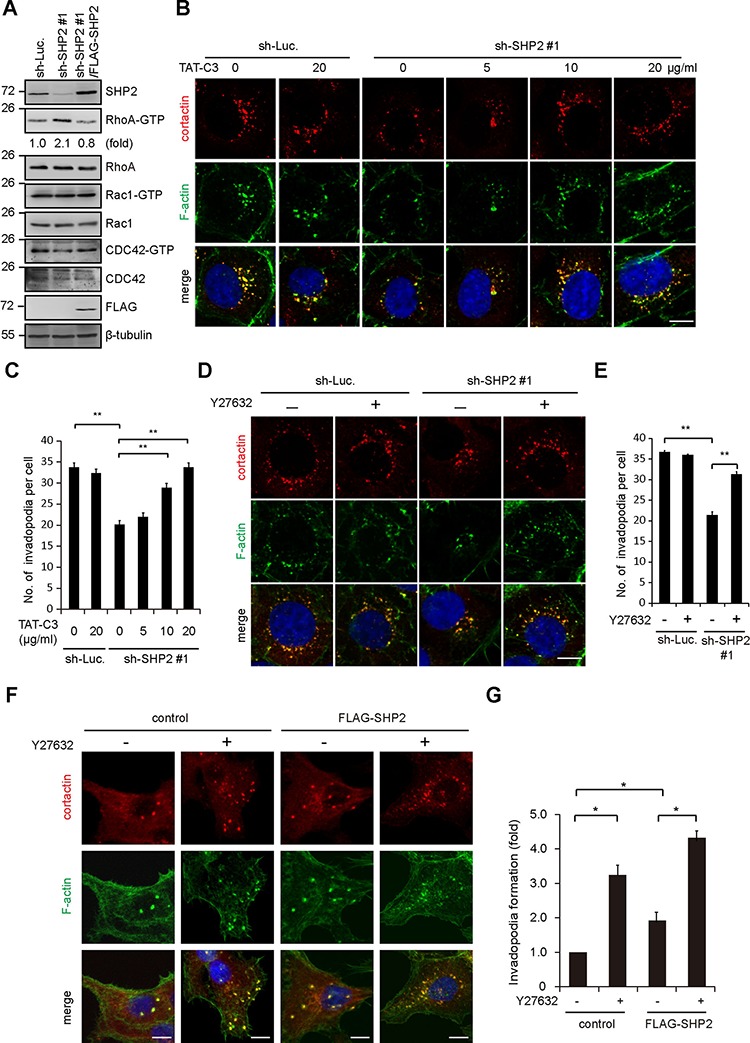
Figure 5. SHP2 promotes invadopodia formation by suppression of Rho activity.

A. The levels of active (GTP-bound) Rho family proteins in the cells, including RhoA, Rac1, and Cdc42, were measured. The results are representative at least three experiments. B. SAS cells expressing shRNA specific to SHP2 (sh-SHP2 #1) or luciferase (sh-Luc.) were grown on gelatin-coated glass coverslips for 24 h and then treated with TAT-C3 at various concentrations for 12 h and then fixed. The fixed cells were stained for F-actin and cortactin. Scale bar, 10 μm. C. Quantitative results of invadopodia formation in B. The number of invadopodia per cell is shown (n > 100). Values (means ± s.d.) are from three independent experiments; *P < 0.05; **P < 0.001. D. SAS cells expressing shRNA specific to SHP2 (sh-SHP2 #1) or luciferase (sh-Luc.) were grown on gelatin-coated glass coverslips for 24 h and then treated with (+) or without (−) the ROCK inhibitor Y27632 (10 μM) for 6 h and then fixed. The fixed cells were stained for F-actin and cortactin. Scale bar, 10 μm. E. Quantitative results of invadopodia formation in D. The number of invadopodia per cell is shown (n > 100). Values (means ± s.d.) are from three independent experiments; *P < 0.05; **P < 0.001. F. Control CAL27 cells and those stably expressing FLAG-SHP2 were grown on gelatin-coated coverslips for 24 h and then treated with (−) or without (+) the ROCK inhibitor Y27632 (10 μM) for 6 h. The cells were fixed and stained for F-actin and cortactin. Scare bar, 10 μm. G. Quantitative results of invadopodia formation in F. The number of invadopodia per cell was determined (n > 150). The data are expressed as fold relative to the control CAL27 cells. Values (means ± s.d.) are from three independent experiments; *P < 0.05; **P < 0.001.
