
Figure 6. NCOA1 protein expression and its correlations with human breast tumor microvascular density (MVD) and patient survival.
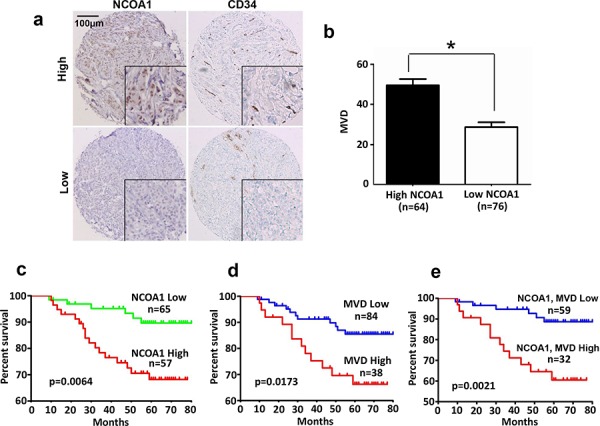
a. Representative images of high and low immunoreactivities of NCOA1 and CD34 in breast tumor sections. Images were taken at the magnification of 200×. b. Semi-quantitative analysis of MVD in breast tumor tissues with high NCOA1 (immunoreactivity score ≥ 3) and low NCOA1 (immunoreactivity score < 3) protein expression. Data are presented as Mean ± SD microvessels per 200× viewing field. *P < 0.05 by Chi-square test. c–d. The Kaplan Meier survival curves of breast cancer patients with high versus low NCOA1 protein expression (panel c), with high MVD (>40) versus low MVD (≤40) (panel d), and with both high NCOA1 and high MVD versus both low NCOA1 and MVD (panel e). The indicated p values were calculated by Logrank test. n, number of patients.