
Figure 6. Effect of HPV16 E6 and E7 repression on apoptosis.
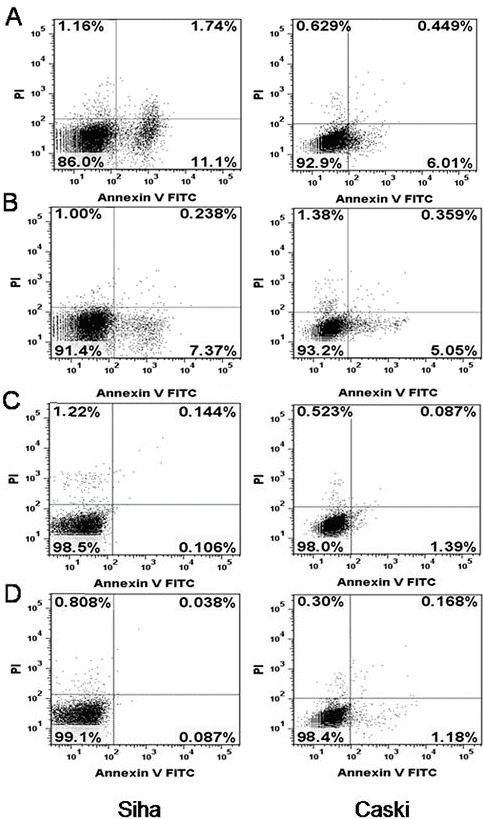
(A) SiHa and CaSki cells infected with lentiviruses expressing E6-shRNA. (B) SiHa and CaSki cells infected with lentiviruses expressing E7-shRNA. (C) SiHa and CaSki cells infected with lentiviruses expressing control shRNA. (D) Uninfected SiHa and CaSki cells. Cells were assayed by flow cytometry for annexin V binding and PI staining 72 hours after infection. The logarithm of annexin V-fluorescein isothiocyanate fluorescence and the logarithm of PI fluorescence were plotted on the x and y axes of the cytogram. The lower right quadrant shows the percentage of viable cells in the early stages of apoptosis (ie, annexin V-positive, PI-negative cells), the upper right quadrant shows the percentage of cells in a later stage of apoptosis or necrosis (annexin V-positive, PI-positive cells), the lower left shows the percentage of cells in the proliferating-senescence state and the upper left quadrant shows the percentage of dead cells.