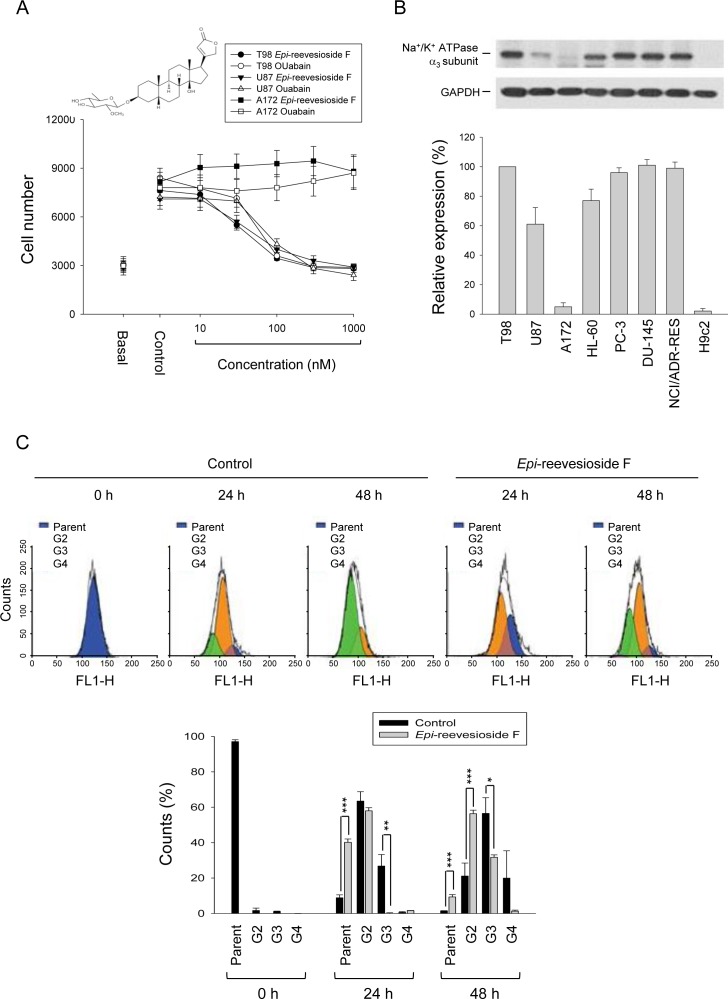
Figure 1. Effect of Epi-reevesioside F on cell proliferation and protein expression of Na+/K+-ATPase α3 subunit.
(A) The graded concentrations of Epi-reevesioside F and ouabain were added to the cells for 48 hours (T98 and A172 cells) or 72 hours (U87 cells). After the treatment, cell proliferation was determined using sulforhodamine B assay. (B) The cells were lysed for the detection of protein expression by Western blot analysis. The expression was quantified using computerized image analysis system ImageQuant (Amersham Biosciences). (C) T98 cells were incubated in the absence of presence of Epi-reevesioside F (100 nM) for the indicated time. After treatment, the cells were fixed and labeled with CFSE for flow cytometric analysis. Data are expressed as mean±SEM of three to five independent determinations. *P < 0.05, **P < 0.01 and ***P < 0.001 compared with the parent cells.

