
Figure 7. DNA methylation changes of the miR-210 promoter in patients with atherosclerosis, stroke, and gastrointestinal cancer.
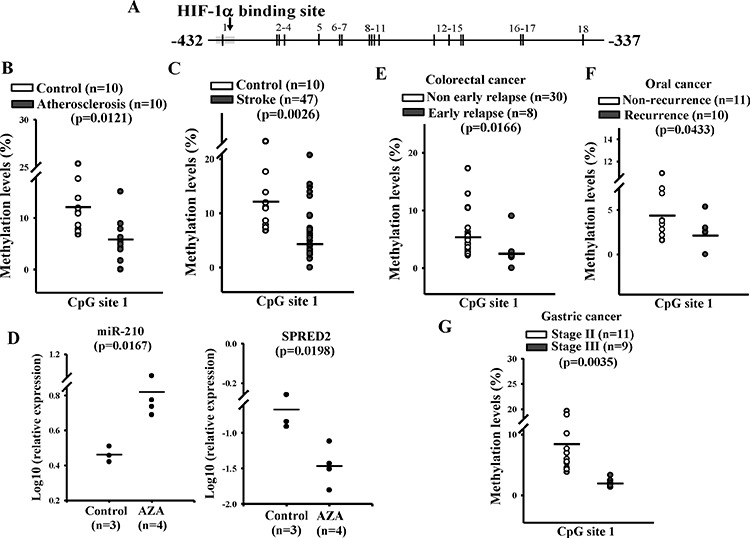
A. Schematic diagram shows 18 CpG sites located between −432 and −337 bp in the miR-210 promoter. Methylation levels of these 18 CpG sites were individually measured by pyrosequencing. The fully Methylation results of these 18 CpG sites were showed in supplementary data. B and C. Methylation levels in the CpG site 1 of miR-210 promoter in atherosclerosis and stroke patients than controls. Genomic DNA was collected from the whole blood of control subjects (n = 10), and atherosclerosis (n = 10) and stroke (n = 47) patients. After bisulfite treatment and pyrosequencing, methylation levels were determined by PyroMark Q24 (Qiagen). D. Relative miR-210 and SPRED2 levels in AZA-treated xenograft animals. Mice with HT-29 xenografts were subcutaneously injected with PBS (n = 3) or 5 mg/kg AZA (n = 4) every 3 days. After treatment for 3 weeks, total RNA was extracted from the tumor. miR-210 and SPRED2 mRNA levels were determined by a quantitative real-time PCR. Data are means ± SD of three experiments. *P < 0.05. E to G. Methylation level changes in the CpG site 1 of miR-210 promoter in different cancer samples. Genomic DNA was collected from patients’ cancer tissues. After bisulfite treatment and pyrosequencing, methylation levels were determined by PyroMark Q24 (Qiagen). E. Non-early relapse (n = 30) vs. early relapse (n = 8) in colorectal cancer patients, F. non-recurrence (n = 11) vs. recurrence (n = 10) in oral cancer patients, and G. stage II (n = 11) vs. stage III (n = 9) gastric cancer. Any outlier > mean ± 3 SD needs to be removed.