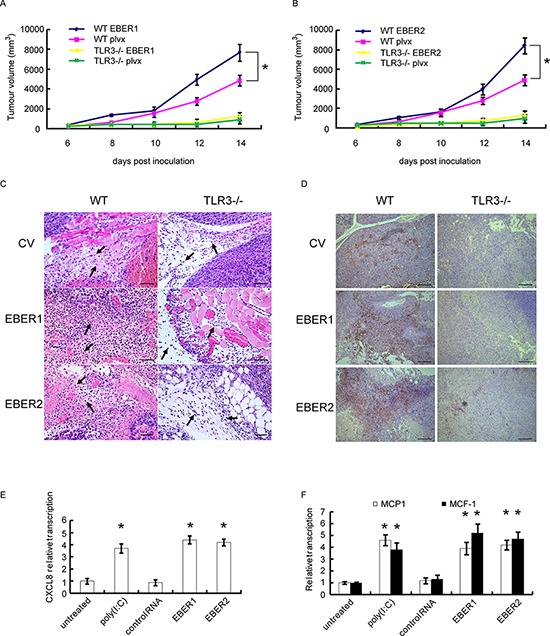
Figure 4. Effect of EBERs-TLR3 on B16 tumor growth and macrophage infiltration.

A and B. B16 cells stably transduced with lentiviral vectors expressing EBER1 (A) or EBER2 (B) were inoculated into WT or TLR3−/− C57 BL/6 mice. B16 tumor growth curves were presented (n = 5). plvx is the empty lentiviral vector control. C. Monocyte infiltration (where the arrows pointed) represented by HE staining of B16 tumor slides derived from (A) and (B) Scale bar: 25 μm. D. Macrophage infiltration represented by IHC assay where the tissues were stained with CD68 antibody as shown in brown. Scale bar: 100 μm. E. HNE2 cells were stimulated with EBER1, EBER2, control RNA and Poly(IC) for 24 h, from which the culture supernatant were collected and added to U937 cells for 24 h. RNA from U937 cells was extracted and expression of CXCL8 was determined by qPCR. F. MCP-1 and M-CSF status were analyzed by qPCR after HNE2 cells were transfected with in vitro transcribed EBER1 or EBER2. All experiments were performed at least three times and representative data are presented. In (A) and (B), *P < 0.05 between assigned groups. In (E) and (F), *P < 0.05 between untreated/control and any other groups.
