
Figure 2. Depletion of eIF3b and/or eIF3c decreases proliferation and cell size of IMR-90 cells.
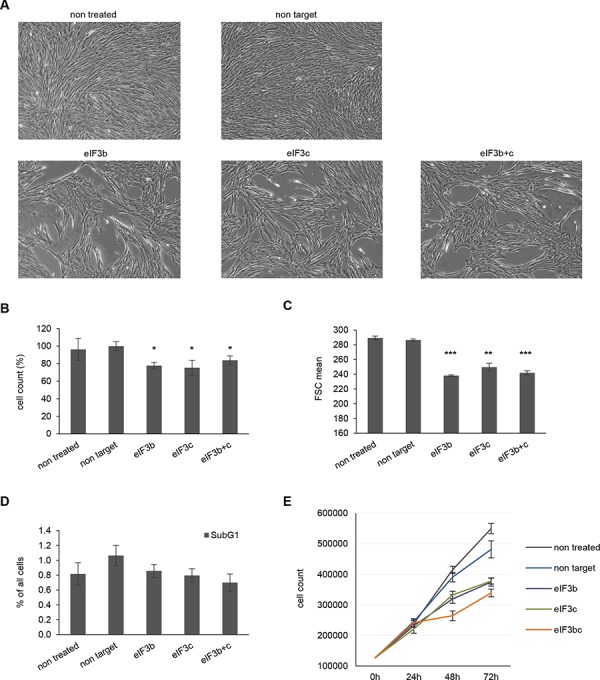
A. Representative pictures of siRNA treated IMR-90 cells 72 hours post transfection are shown (magnification 4x). B. Cell numbers were measured using Casy cell counter at 72 h after transfection. Total numbers were normalized to non-target siRNA-transfected cells. C. Cell size was assessed by flow cytometry using the parameter forward scatter (FSC). D. Percentage of apoptotic cells (subG1-fraction) was determined by flow cytometry of propidium iodide (PI)-labeled cells at 72 h post transfection. One representative experiment out of two is shown. E. Proliferation curves of control and eIF3b-, eIF3c- and eIF3b and c-depleted IMR-90 cells. Cells were transfected and counted at 0, 24, 48 and 72 hours post transfection. (B and C) Figures show means of two independent experiments performed in triplicates. Error bars represent means ± SD.