
Figure 2. Erastin induces HO-1 expression in HT-1080 fibrosacoma cells.
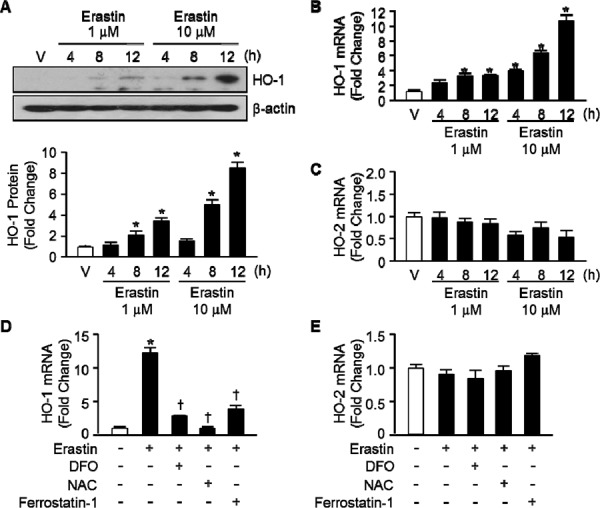
A. Western blotting for HO-1 was performed 4, 8, and 12 hours after vehicle (V), or Erastin (1 μMor 10 μM) in HT-1080 fibrosacoma cells. β-actin was used as controls for normalization. This represents a representative blot of three independent experiments. The fold change in protein levels were quantitated as signal intensity corrected for loading in vehicle or Erastin treated cells. *p < 0.05 vs vehicle. Values are mean ± SD, n = 3. Quantitative real-time PCR was performed to assess mRNA levels of HO-1 B. and HO-2 C. in HT-1080 fibrosacoma cells. *p < 0.05 vs vehicle. Quantitative real-time PCR was performed to assess mRNA levels of HO-1 D. and HO-2 E. 12 hours after vehicle, Erastin, or Erastin plus DFO, NAC, or ferrostatin-1 administration in HT-1080 fibrosacoma cells. *p < 0.05 vs vehicle, †p < 0.05 vs Erastin. Values are mean ± SD, n = 3.