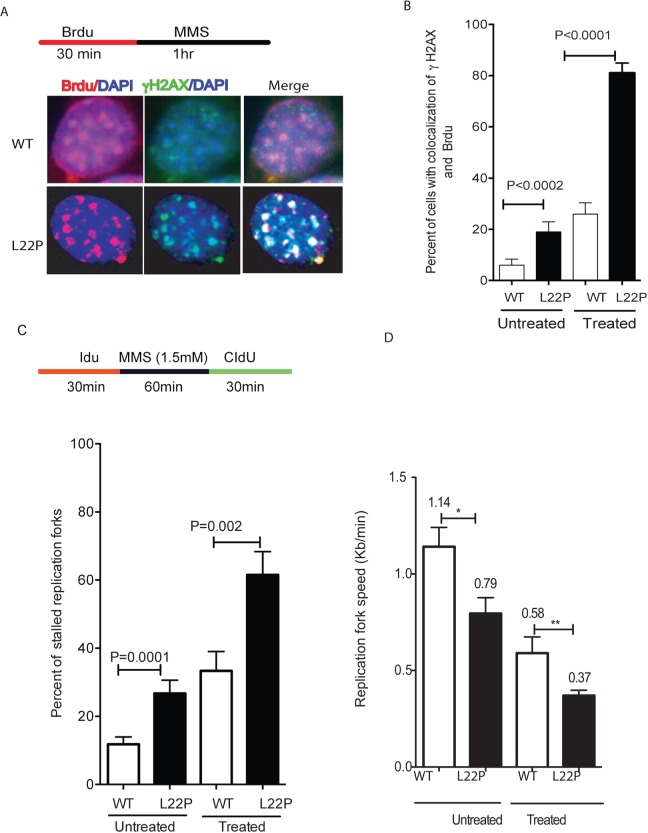
Figure 2. Replication fibers and fork rates in wild type (WT) and L22P-expressing GES-1 cells.
A. Representative images of co-localization of γH2Ax and Brdu positive cells. B. Estimated number of cells with co-localization of γH2Ax and Brdu positive WT (n = 143) and L22P-expressing cells (n = 160) treated with MMS versus untreated WT (n = 97) and L22P (n = 102). Double positive cells (γH2Ax +Brdu) in L22P-expressing cells are a statistically significant difference compared to WT (P < 0.001). C. Estimated percentage of replication fork stall in L22p expressing cells and WT GES-1 cells. Note that the schematic representation of replication tracts in WT and L22P-expressing GES cells were first labeled with Idu (25μm) for 30 minutes (red line), then treated with 1.5 mM MMS for 1 hour (black line) followed by a second labeling with CIdU (250μm) for 30 minutes (green) then processed for DNA fiber spread as described in Materials and Methods. D. Estimated replication fork speed in cells expressing L22P and WT before and after treatment with 1.5mM MMS and HU.

