
Figure 4. Kaplan-Meier DM rate curves for stage IIb-IVb patients in different risk subclassifications treated with IMRT alone and CCRT±NACT.
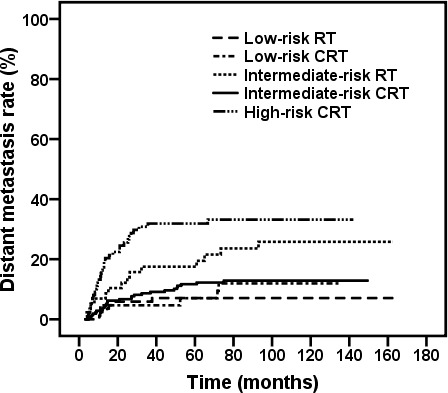
(Low risk: RT vs. CCRT, χ2 = 0.703, P = 0.402; Intermediate risk: RT vs. CCRT, χ2 = 5.032, P = 0.025). In patients who received CCRT ± NACT, low vs. intermediate, χ2 = 0.054, P = 0.816; low vs. high, χ2 = 7.210, P < 0.007; intermediate vs. high, χ2 = 20.545, P < 0.001.