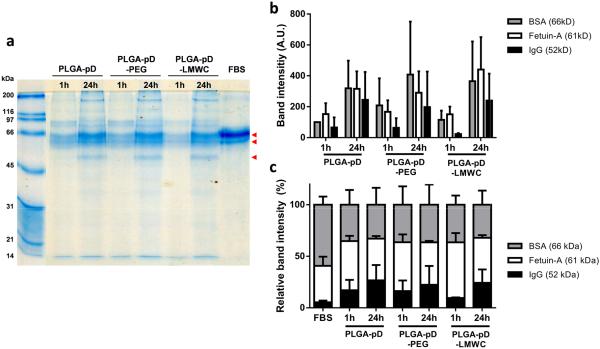
Fig. 5.
Analysis of the composition of protein hard corona formed on NP surface after incubation in 50% FBS for 1 or 24 hours. Hard corona proteins were stripped off NPs and resolved via SDS-PAGE on a 12% gel along with size standards and 200 fold diluted FBS. Gels were stained with Coomassie blue G-250. (a) A representative gel of resolved hard corona proteins. Arrow heads indicate three prominent bands. (b) Band intensity of three proteins pointed with arrow heads in (a). (c) Relative band intensity (% of band intensity divided by the sum of three prominent band intensities). The gel image was analyzed via ImageJ 1.48v software. (b) and (c) show averages and standard deviations of 4 independently and identically run gels with 4 different batches.

