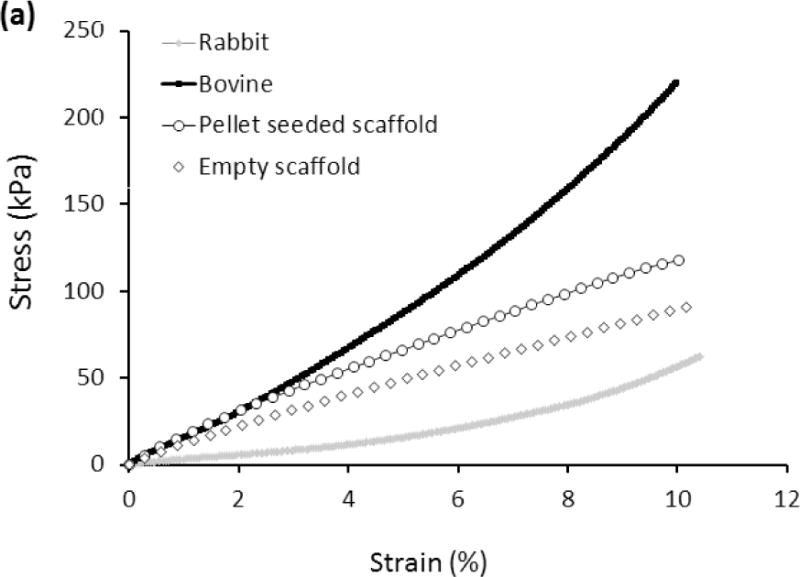
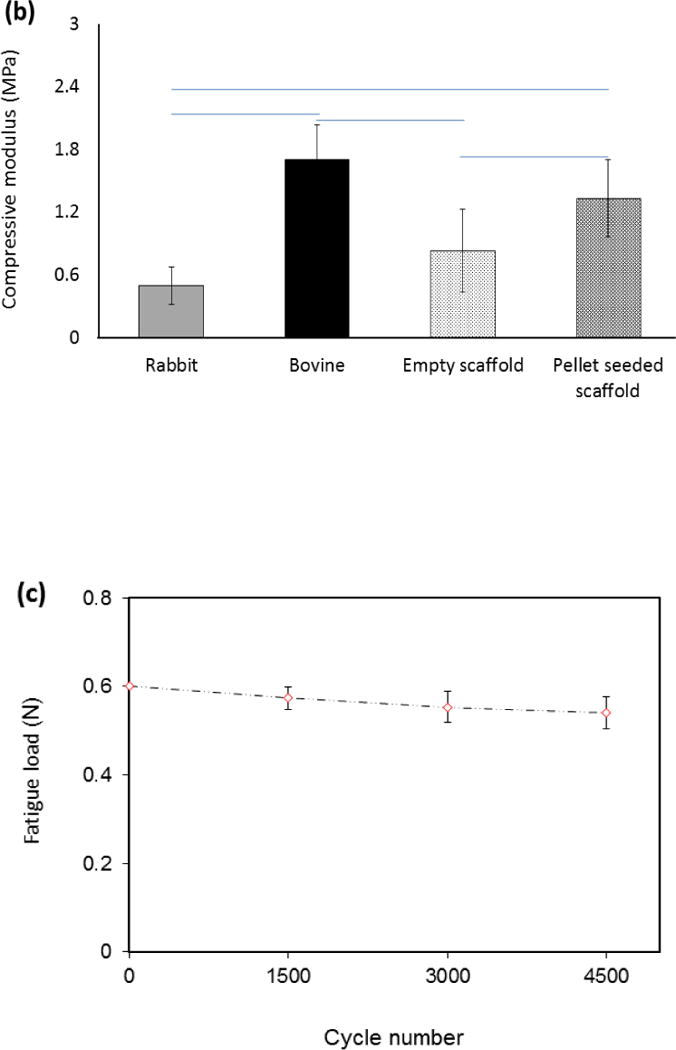
Figure 3.


(a) Mechanical characterization of the woven cartilage scaffold. Comparison of stress-strain curves of woven scaffold with rabbit and bovine cartilage. The strength of the scaffold is situated between rabbit and bovine cartilage. (b) Young’s modulus of cells seeded scaffold was greater than that of the blank scaffold and did not differ significantly from that of bovine cartilage. The horizontal lines between individual groups represent statistically significant difference based on one way ANOVA test with Tukey’s pairwise comparison (p<0.05). (c) Decrease in fatigue load of the scaffold under constant strain (15%) up to 4500 load cycles. Fatigue load decreases by about 8% after 4500 cycles.
