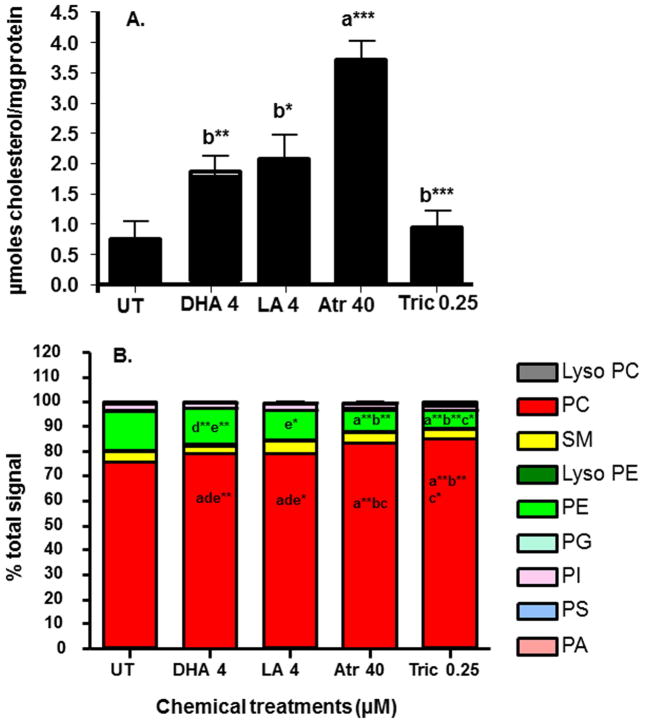
Fig. 3. Cholesterol concentrations and relative polar lipid levels in daphnids following four days of exposure to different chemicals.
(A) Cholesterol concentrations in homogenized daphnids. Data are presented as mean ± SEM. Data was analysed by one-way ANOVA followed by Tukey’s multiple comparison test (n=6) (*p<0.05, **p<0.01 and ***p<0.001). An ‘a’ is different from UT and ‘b’ is different from Atr. (B) Relative polar lipid levels from chemically-exposed daphnids. Data were analyzed by two-way ANOVA (with repeated measures) followed by Bonferroni post-hoc test (n=5). ‘a’ is different from UT, ‘b’ is different from DHA, ‘c’ is different from LA, ‘d’ is different from Atr and ‘e’ is different from Tric (p<0.05, *p<0.01, **p<0.001).

