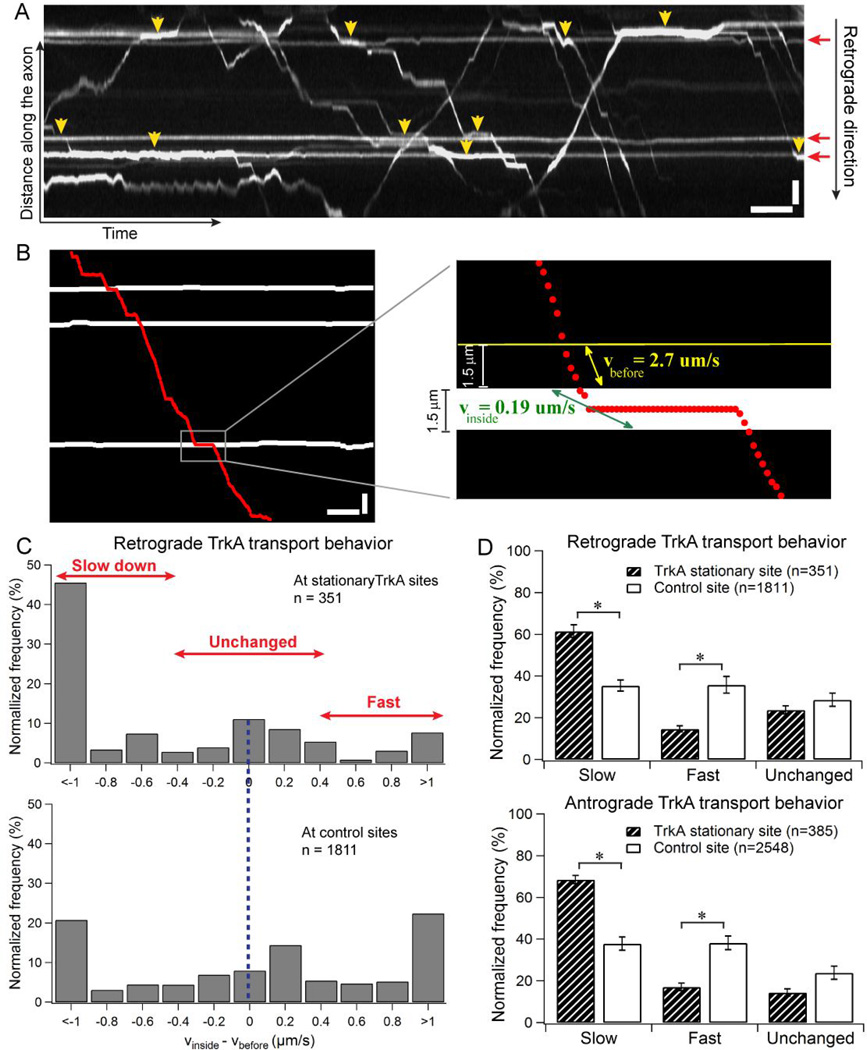
Figure 1.
Moving TrkA cargos slow down when crossing stationary TrkA markers in DRG axons. (A) Kymograph of TrkA trajectories in DRG neurons transfected with TrkA-mCherry. Horizontal lines (red arrows) indicate the stationary TrkA in the axon. Yellow arrowheads show the regions where the moving TrkA cargos clearly slow down when crossing the stationary TrkA. (B) The process of quantifying TrkA transport behavior when crossing stationary markers. The trajectory of a retrograde TrkA cargo (red dots) is overlapped onto the positions of the stationary TrkA (white horizontal lines) in the same axon. Inset shows enlarged image of a crossing event (gray rectangle in the original kymograph), where the speed of the cargo right before the stationary TrkA region (vbefore, yellow) is compared to the speed of the cargo inside the stationary TrkA region (vinside, green). (C) Comparison of the distribution of Δv (vbefore−vinside) for retrogradely moving TrkA cargos when crossing stationary TrkA sites (n=351) vs. when crossing control sites that are absent of stationary TrkA (n=1811). (D) TrkA transport behavior when crossing stationary TrkA markers is categorized into three groups – slow, fast and unchanged based on Δv (vbefore−vinside) values. Data were cumulated from 7 independent experiments. The cargo behavior is normalized to the total number of crossing events. Bootstrapping (10 sets of 300 randomly selected events) was performed to calculate the standard deviation. Error bars represents standard deviation. Statistical significance was assessed using Student’s t-test, p<0.001. Horizontal bar, 5s. Vertical bar, 5 µm.

