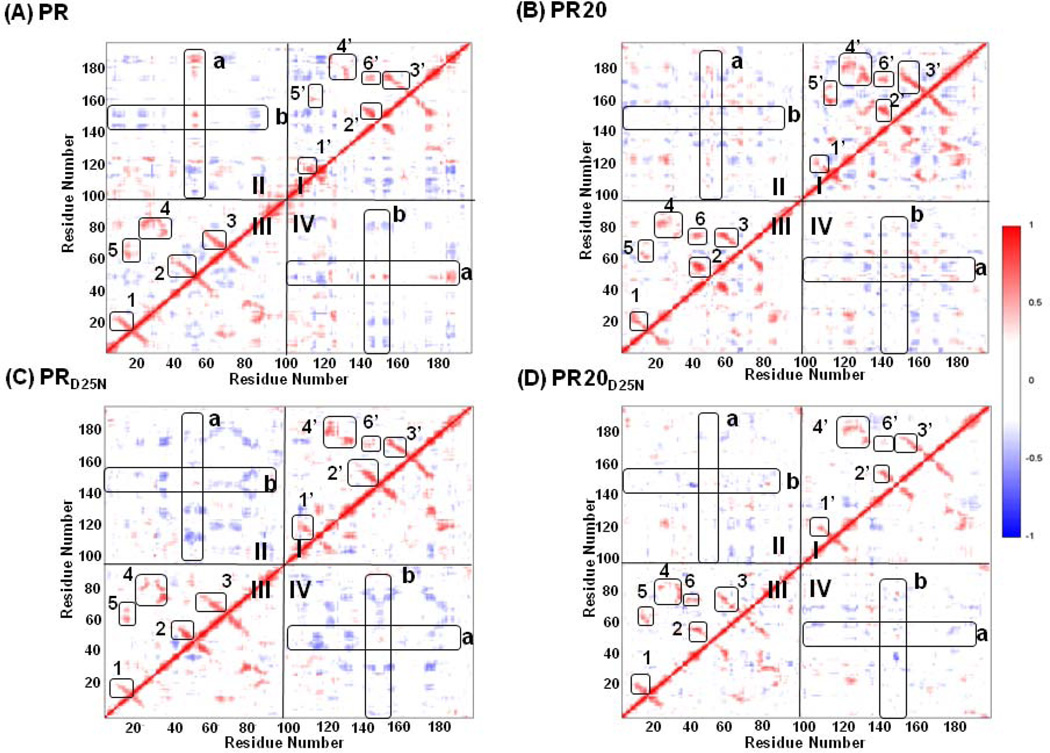
Figure 7.
Dynamic Cross Correlation Maps show correlated motions in dimers: (A) PRMD; (B) PR20MD; (C) PRD25NMD and (D) PR20D25NMD. Cross-correlation coefficients Cij larger than 0.25 and smaller than −0.25 are shown in maps with the intensity represented as follows: red squares 0.25 <Cij< 1; blue squares −1 <Cij< −0.25. Quadrants I and III show intra-subunit correlated motions. Boxes 1; 2; and 3 correspond to surface turns between two beta-strands. Box 4 corresponds to two interacting loops within the active site cavity. Boxes 5 and 6 correspond to interactions between the flap residues and the surface loops. Quadrant II and the symmetry related quadrant IV show inter-subunit correlated motions. The boxes in these quadrants indicate the flap residues from the two monomers. The two flaps in both PR20 and PR20D25N show less correlation than is seen for the wild type protein.

