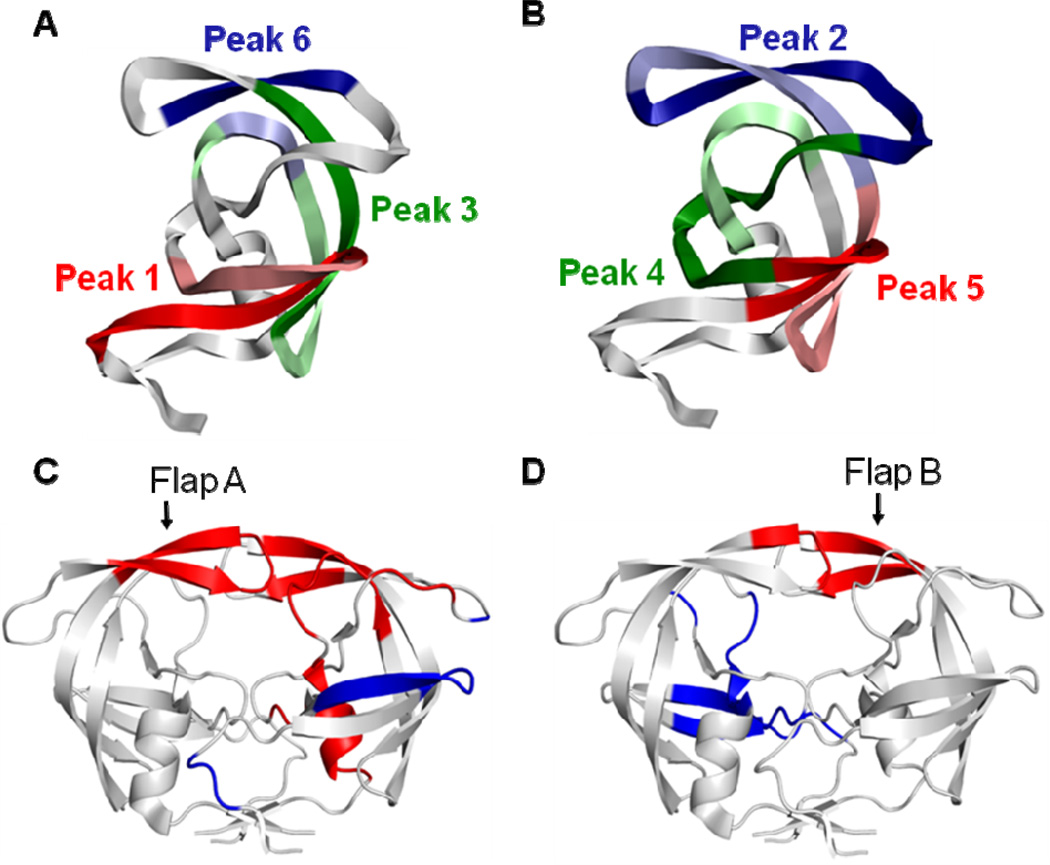
Figure 8.
Correlated motions mapped onto the protease structure. (A) and (B): Intrasubunit correlations from quadrants I and III of Figure 7 are shown in two panels to minimize overlap of residues. Six positively correlated peaks are labeled in the intra-subunit quadrants I and III of all subunits except that peak 5’ is absent from the second subunit of PR20D25NMD. Each peak defines two regions of residues represented as dark and light colors. The corresponding residues and colors are listed inside the parentheses: (A) Peak 1 (6–17 red and 15–25 light red); Peak 3 (56–67 green and 67–81 indicated in light green-light blue-light green due to overlap with residues of Peak 6); and Peak 6 (43–48 blue and 76–79 light blue). (B) Peak 2 (37–52 blue and 51–63 light blue); Peak 4 (21–36 green and 76–87 light green); and Peak 5 (12–21 red and 61–71 light red). (C) and (D): The peaks for intersubunit correlated motions in PRMD are also illustrated in two panels to avoid overlaps. Higher peaks occur for residues showing correlated motions with the two flaps (residues 45–55 in each subunit). Positively correlated motions are colored red; and anti-correlated motions are colored blue. (C) Residues 24’–25’; 35’–37’; 46’–48’; 53’–56’; 76’–82’; 84’–85’ and 87’–92’ have positively correlated motions with the flap residues 45–55 in the first subunit; and residues 4’–6’; 15’–22’ and 39’ show anti-correlated motions. (D) Residues 50–53 show positively correlated motion with the second flap (residues 45’–55’); and residues 7–13; 20–26; 34–35 and 81–86 have anti-correlated motions.

