Fig. 3.
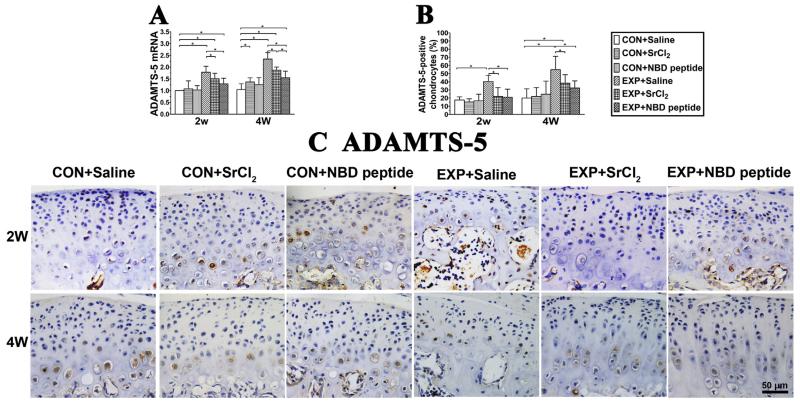
Expression changes of ADAMTS-5 in mandibular condylar cartilage from the control and UAC mice. (A) ADAMTS-5 mRNA. P values: 2w: CON + Saline vs UAC + Saline, UAC + SrCl2 and UAC + NBD peptide: P < 0.001, P < 0.001 and P = 0.023; UAC + Saline vs UAC + SrCl2 and UAC + NBD peptide: P = 0.03 and P < 0.001; 4w: CON + Saline vs CON + SrCl2, UAC + Saline, UAC + SrCl2 and UAC + NBD peptide: P = 0.015, P < 0.001, P < 0.001 and P < 0.001; UAC + Saline vs UAC + SrCl2 and UAC + NBD peptide: P = 0.001 and P < 0.001; UAC + SrCl2 vs UAC + NBD peptide: P = 0.018. (B) Percentages of ADAMTS-5-positive chondrocyte. P values: 2w: P-values between groups with * are less than 0.001; 4w: CON + Saline vs UAC + Saline and UAC + SrCl2: P < 0.001 and P = 0.008; UAC + Saline vs UAC + SrCl2 and UAC + NBD peptide: P = 0.017 and P = 0.018. (C) Representative sections of IHC staining of ADAMTS-5 in condylar cartilage from the 2-week and 4-week groups were shown. Bar = 50 μm n = 3; data are expressed as means and 95% confidence intervals (CIs); * indicates statistically significant differences between groups.

