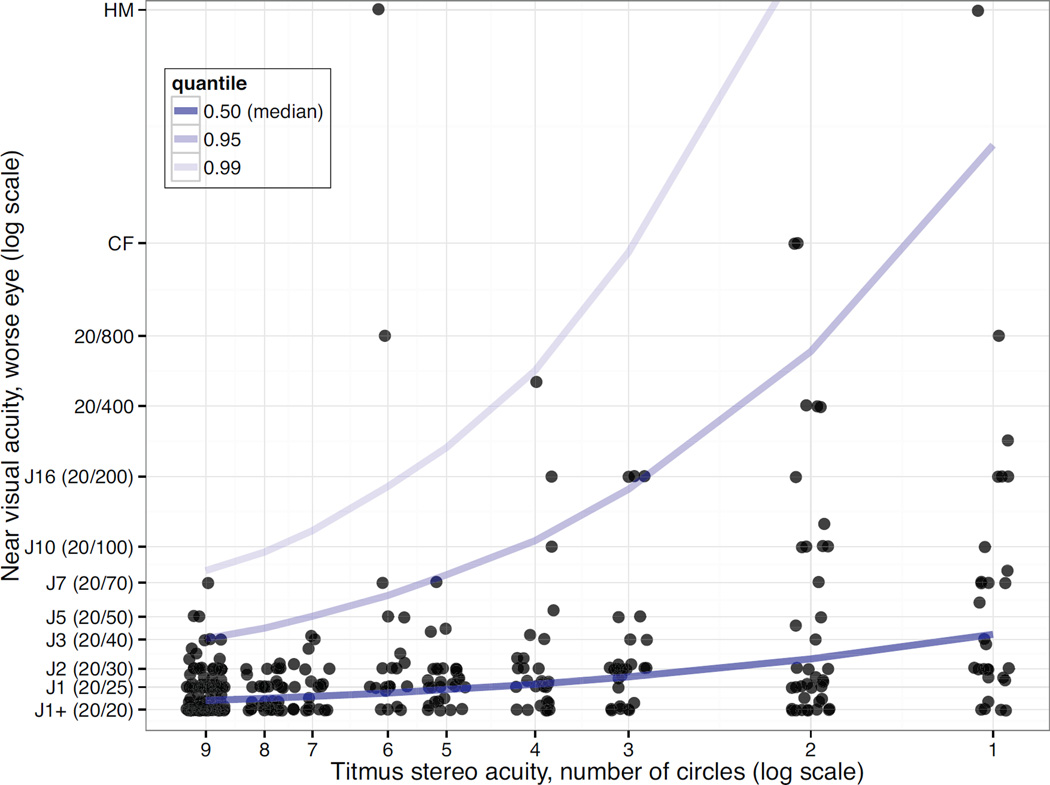
Figure 2.
Graphical depiction of worst eye near visual acuity (log scale) as a function of measured Titmus stereoacuity (log scale of circle score). Darkest blue line represents median visual acuity, medium blue line represents 95th prediction interval, and light blue line represents 99th prediction interval. Dots represent individual subjects and are jittered on the x-axis for visualization purposes.

