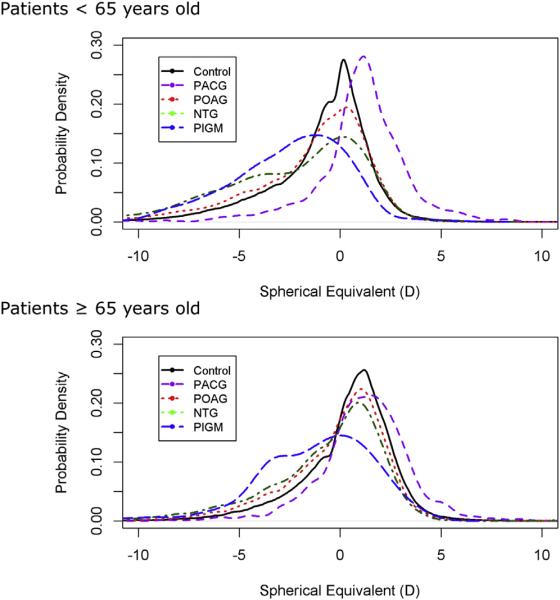
Figure 3.
The comparison of spherical equivalent distribution in right eyes (OD) between glaucoma cases and controls. There were greater differences in spherical equivalent among glaucoma cases and controls younger than 65 years than those 65 years of age or older. Distributions are plotted as probability density. NTG = normal-tension glaucoma; PACG = primary angle-closure glaucoma; PIGM = pigmentary glaucoma; POAG = primary open-angle glaucoma.

