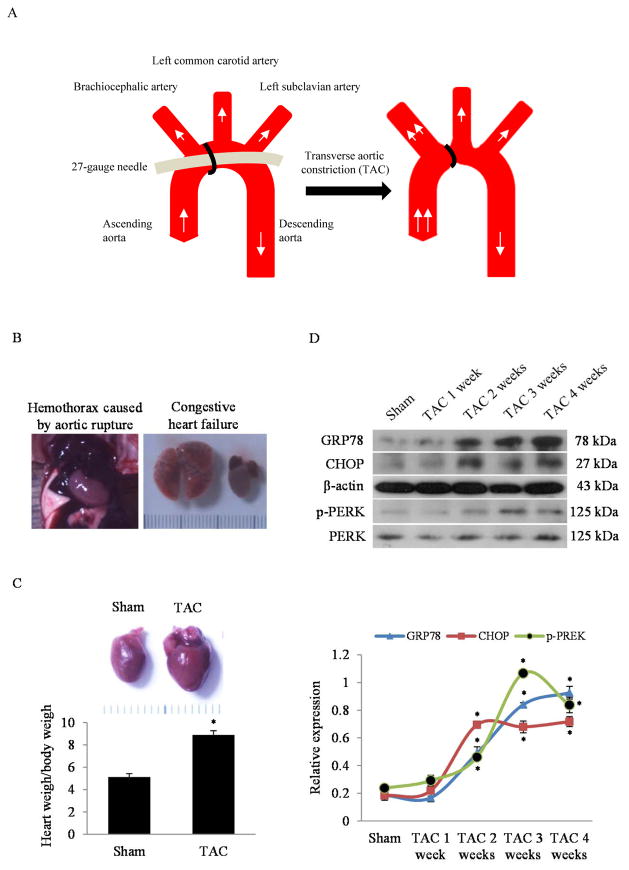
Fig. 1. Cardiac hypertrophy and ER stress response in mice following TAC.
(A) The diagram of transverse aortic constriction (TAC) in mouse. (B) The representative autopsy pictures of aortic rupture and congestive heart failure within the 4 weeks of TAC. (C) Representative autopsy pictures of the normal heart and hypertrophic heart induced by pressure overload for 4 weeks and the corresponding quantitative analysis of heart weight over body weight ratio. *P<0.05 vs. Sham; n=8 in each group. (D) Western blots and quantitative analysis of ER stress response markers (GRP78, CHOP and p-PERK) in the whole heart homogenates of mice in designated time points after TAC. *P<0.05 vs. Sham; n=3.

