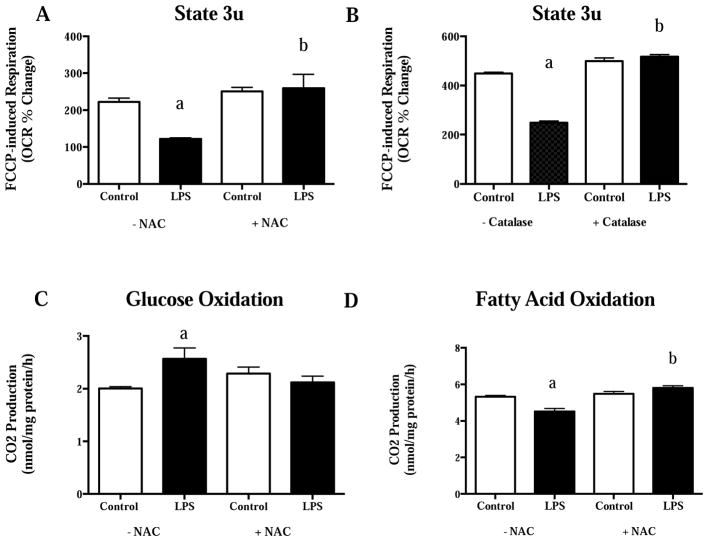
Figure 2.
A) FCCP-stimulated maximal respiration with and without 20 mmol/L NAC, B) FCCP-stimulated maximal respiration with and without 25 U/mL of catalase, C) glucose oxidation with and without 20 mmol/L NAC, and D) fatty acid oxidation with and without 20 mmol/L NAC in C2C12 cells following 2-hour LPS treatment (50 pg/mL). a, significantly different from control without NAC/Catalase co-treatment, P<0.05. b, significantly different from LPS treatment without NAC/Catalase co-treatment, P<0.05. Data are presented as mean± SE. FCCP= Carbonyl cyanide-p-trifluoromethoxyphenylhydrazone; NAC=N-acetyl cysteine. Figure redrawn from Frisard et al.42.

