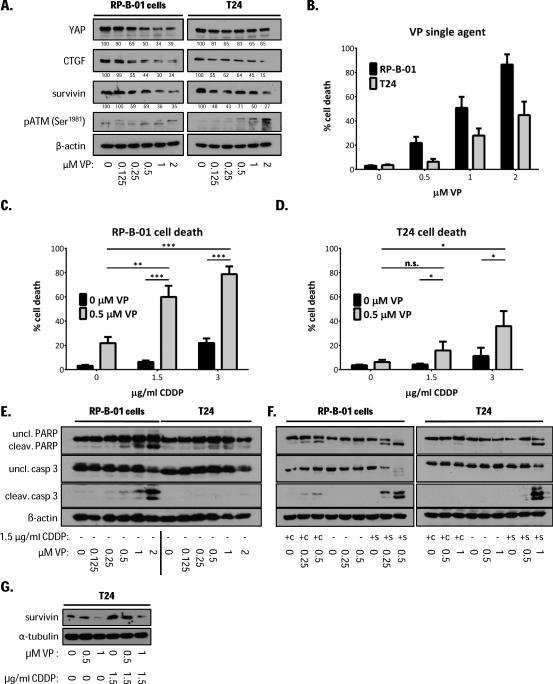
Figure 6. Verteporfin anti-tumor effect in UCC models.
A. Western blot analysis of DNA damage response (pATM), YAP and its downstream genes CTGF and survivin in RP-B-01 and T24 cells, 18 hours after verteporfin (VP) treatment. Cell death plots represent mean percentage cell death ± SD by trypan blue exclusion assay. B. 48 hours after VP single agent treatment in RP-B-01 and T24 cells. C. 18 hours VP pre-treatment followed by 30 hours CDDP in RP-B-01 and D. T24 cells. E. Apoptosis markers detection in cells treated as described in panel B. F. Apoptosis detection in RP-B-01 and T24 cells treated with indicated concentrations of VP and CDDP. Concomitant treatment (+c): cells harvested 48 hours post treatments. Sequential treatment (+s): 18 hours VP pre-treatment followed by 12 hours in CDDP, to detect early induction of apoptosis. G. Western blot analysis of survivin expression after cisplatin and verteporfin treatment; β-actin and α-tubulin served as loading control.*p <0.05, **p <0.01, ***p <0.001, using two tailed t-test analysis.

