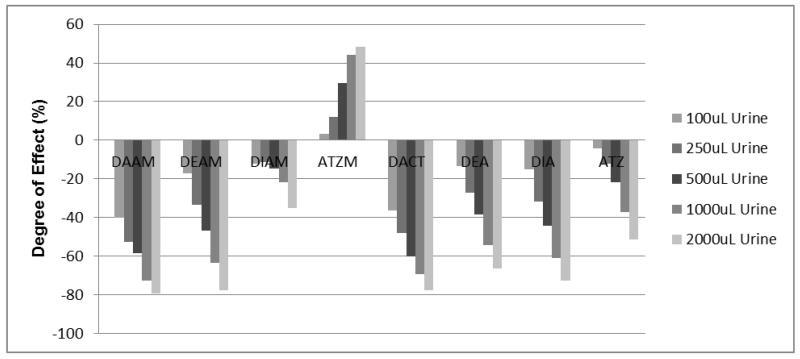
Figure 4. Degree(s) of sensitivity alteration of atrazine and its metabolites observed during an LC-MS/MS analysis in urine samples.
Note: Urinary matrices (each with 3 replicates) were acidified with 2 mL of 2% formic acid and extracted using Strata-XC solid phase extraction cartridges (Phenomenex, Torrance, CA). A detailed methoddescription is provided elsewhere (Panuwet, 2010). The extractants were spiked with known amounts of the standard atrazine and its metabolites (10 ppb) and were subjected to separation and analysis using a QQQ 6490 LC-MS/MS system (Agilent Technology, Waldbronn, Germany) coupled with a positive ESI interface. The LC and MS modules were programmed and controlled using Mass Hunter Software version B.04.01 (Agilent Technologies). A gradient composition of water and MeOH (with 0.2% formic acid) was used during chromatographic separation. A flow rate of 0.7 ml/min was used. The analytical column used was C6-Phenyl (3 μm, 4.6 × 100 mm) from Phenomenex (Torrance, CA). The MS/MS parameters were set as follows: 300 °C drying gas temperature; 325 °C sheath gas temperature; 5 L/min drying gas flow; 10 L/min sheath gas flow; 45 psi nebulizer pressure; 3000 V capillary voltage; 500 V nozzle voltage; 120 msec dwell time; and 200 V delta EMV (+). Nitrogen was used as collision gas. Quantitative MS/MS transitions were: DAAM m/z273 144@9V CE; DACT m/z146
 68@25V CE; DEAM m/z315
 186@13V CE; DEA m/z188
 146@17V CE; DIAM (13C3)m/z304
 175@13V CE; DIA m/z174
 68@25V CE; ATZM m/z343
 214@13V CE; and ATZ m/z216
 174@13V CE. The sample extractant injection volume was 10 μL and the total run time was 20 mins. An average response of each MS/MS transition was calculated. The degree of matrix effects (%) was calculated using the following equation: 100-[(average response of analyte in matrix eluent/average response of analyte in standard solution)*100]. Negative values represent the degree of suppression (%) whereas positive values represent the degree of enhancement (%).

