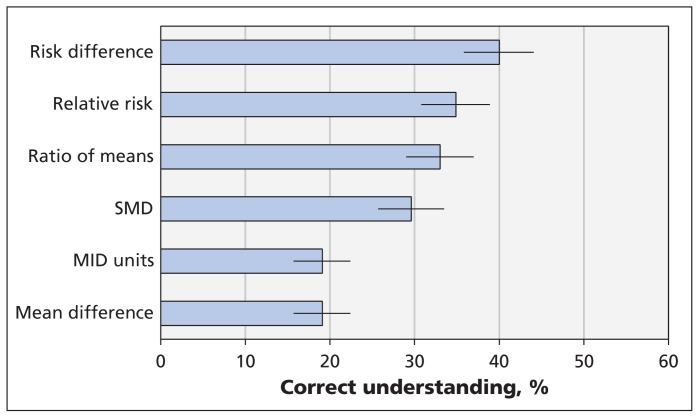
Figure 1:
Respondents’ understanding of the magnitude of the treatment effect for each of 6 statistical formats used to present continuous outcomes from meta-analyses. Higher percentages represent greater understanding; error bars = 95% confidence intervals. Mean difference = mean difference in natural units, MID = minimal important difference, SMD = standardized mean difference.

