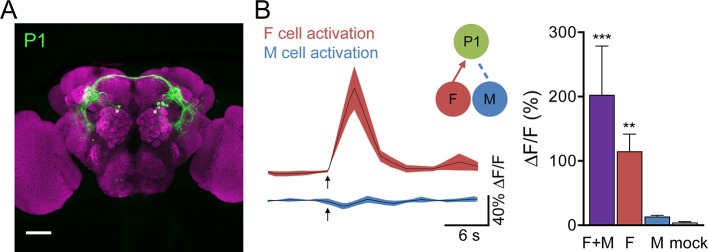
Figure 2. F cells activate courtship-promoting P1 neurons.
(A) Male-specific P1 neurons (green) are located in the protocerebrum. Scale bar, 50 μm. Flies contained P1-Gal4DBD, P1-Gal4AD, UAS-CD8::GFP. (B) ATP-mediated stimulation of F+M cells (ppk23-LexA, lexAop-P2X2), F cells (vGlut-LexA) but not M cells (ppk23-LexA, lexAop-P2X2, vGlut-QF2, QUAS-Gal80) triggered calcium increases in P1 neurons; n = 5–8/condition. Mock is no P2X2. Traces on the left show averaged △F/F with mean in black and SEM shaded. Arrows indicate stimulus. Schematics show cells monitored with GCaMP6s (green) and connections tested. Data are also displayed as bar graph (right). Differences in expression levels of ppk23-LexA and vGlut-LexA may contribute to different response magnitudes of F+M versus F cell stimulation. Mean ± SEM of maximum △F/F. Kruskal-Wallis test, Dunn’s post-hoc to mock, *p<0.05, **p<0.01, ***p<0.001.

