. 2015 Oct 14;4:e05360. doi: 10.7554/eLife.05360

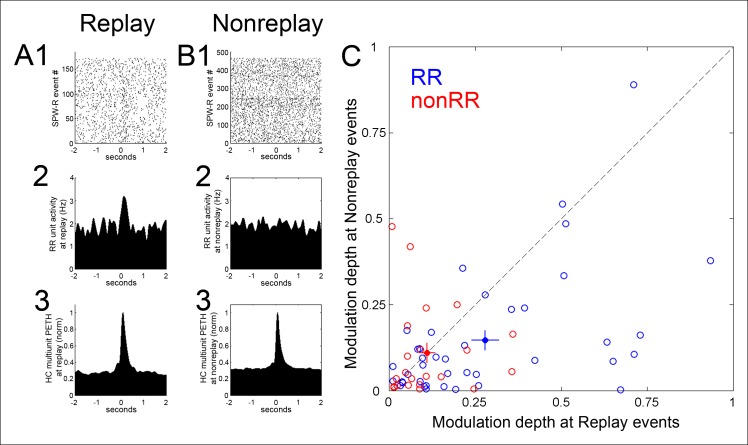
Figure 3. Modulation depth of VTA reward responsive units at hippocampal SPW-R events depends on SPW-R spatial content.

(A) Rastered reward responsive (RR) unit spikes (1) and RR unit and hippocampal (HC) multiunit PETHs (2,3), aligned to the start of SPW-R events encoding replay sequences. (B) As in A, for SPW-R events not encoding replay. (C) PETH modulation depth of RR units (blue) is greater for replay than nonreplay events; p=4.5 × 10-4, signed-rank test). NonRR unit data are shown in red (p=0.6). Solid circles with error bars designate the mean and s.e.m. for RR and nonRR units.

DOI: http://dx.doi.org/10.7554/eLife.05360.006

Figure 3.

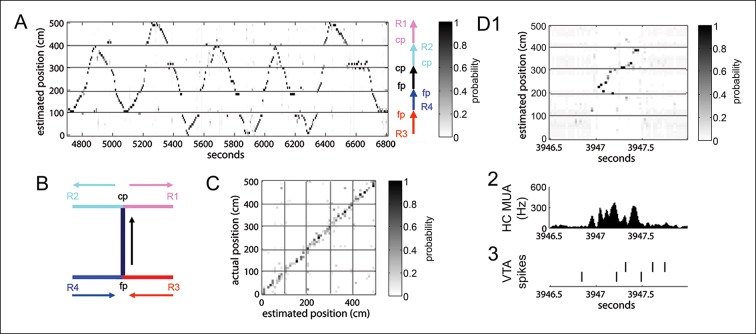
Figure 3—figure supplement 1. Position reconstruction using clusterless hippocampal decoding.

Figure 3—figure supplement 1.

(A) Bayesian reconstruction of run behavior on the spatial working memory task (500 ms time bins). The track has been linearized. (B) Decomposition of the track into segments for linearization. Maze segments were apposed in the direction of run in the choice direction: from force reward sites (R3, R4) to force point (fp) to choice point (cp) to choice reward sites (R1, R2). (C) Confusion plot for this recording session, using alternating 1 s epochs for training and testing the reconstruction algorithm. (D1) Bayesian reconstruction of a SPW-R event reveals spatial sequence reactivation (25 ms time bins). (D2) The associated hippocampal multiunit activity. (D3) The action potentials of two simultaneously recorded reward responsive VTA units.
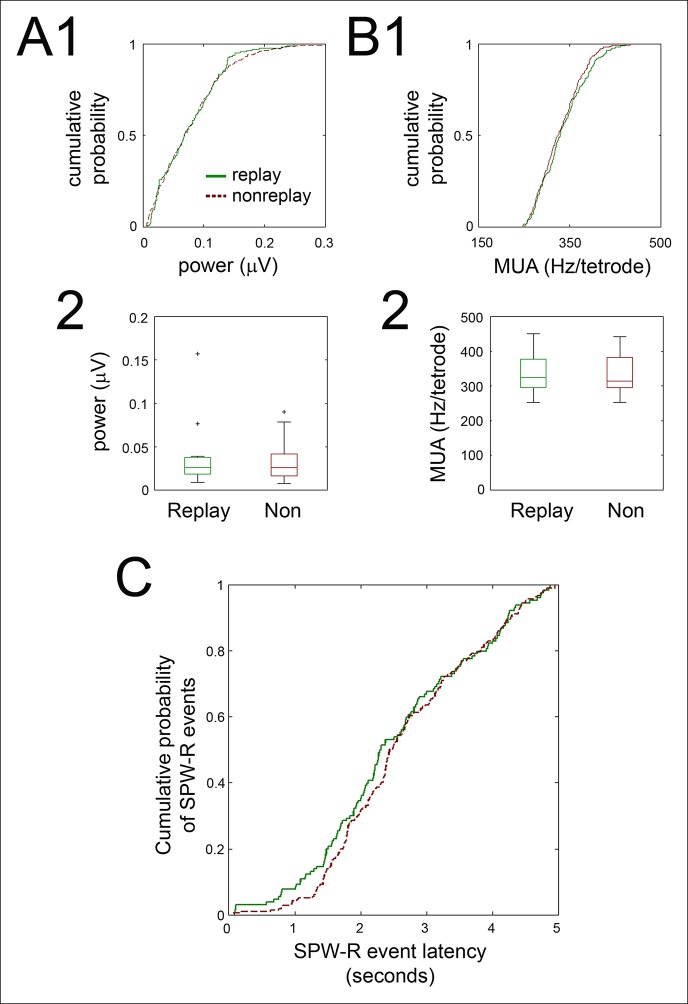
Figure 3—figure supplement 2. Ripple power, SPW-R associated hippocampal activity, and SPW-R event latency in the immediate post-reward period were similar for replay and non-replay events.

Figure 3—figure supplement 2.

(A1) For the recording shown in Figure 3A,B, cumulative ripple-band power of replay (green solid line) and non-replay (brown dashed line) events are displayed. (A2) Across recordings, replay and nonreplay events have similar ripple power (box and whisker plots, medians with interquartile range; p=1, sign-rank test). (B1) Cumulative SPW-R event peak multiunit activity (MUA; Hz/tetrode) for the same example, for replay (green solid) and non-replay (brown dashed) events. (B2) Across recordings, SPW-R event peak MUA is similar for replay and non-replay events (medians with interquartile range; p=0.6, sign-rank test). (C) Cumulative distributions of SPW-R event latencies relative to nosepoke for reward delivery were similar for replay (green solid line) and nonreplay (brown dashed line) SPW-R events (p=0.2, Kolmogorov-Smirnov test).