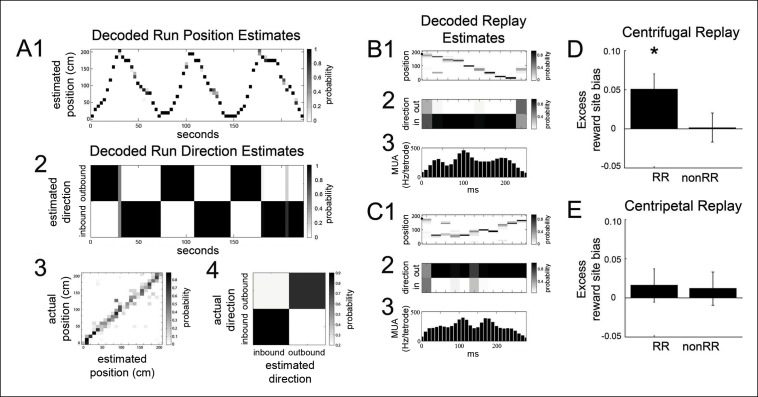
Figure 5. The bias of reward responsive VTA unit activity towards the replay of reward locations is greater for centrifugal than centripetal replay.
(A1,2) Bayesian reconstruction of run position and run direction on the linear track (500 ms time bins). Outbound refers to run direction from 0 to 200 cm. (A3) Position confusion plot for this recording session, using alternating 1 s epochs for training and testing the reconstruction algorithm. (A4) Run direction confusion plot. (B) Centrifugal, forward replay event occurring while the rat paused at the far reward site (190 cm; black circle indicates the rat’s position). (B1) Position reconstruction (25 ms time bins). (B2) direction reconstruction). (B3) The associated hippocampal multiunit activity. (C) Centripetal, forward replay event occurring while the rat paused at the far reward site. (C1) Position reconstruction. (C2) Direction reconstruction. (C3) Associated hippocampal multiunit activity. (D) Across centrifugal replay time bins, RR unit spikes preferentially coordinated with replay of reward locations compared to centrifugal replay content in general (p=0.014, chi=6.0, Chi-square test) and compared to nonRR units at centrifugal replay (p=0.05, nonparametric permutation test). Error bars represent s.d. (E) Across centripetal replay time bins, RR unit spikes showed no increase in coordination with replay of reward locations compared to centripetal replay content in general (p=0.5, chi=0.5, Chi-square test). Error bars represent s.d.


