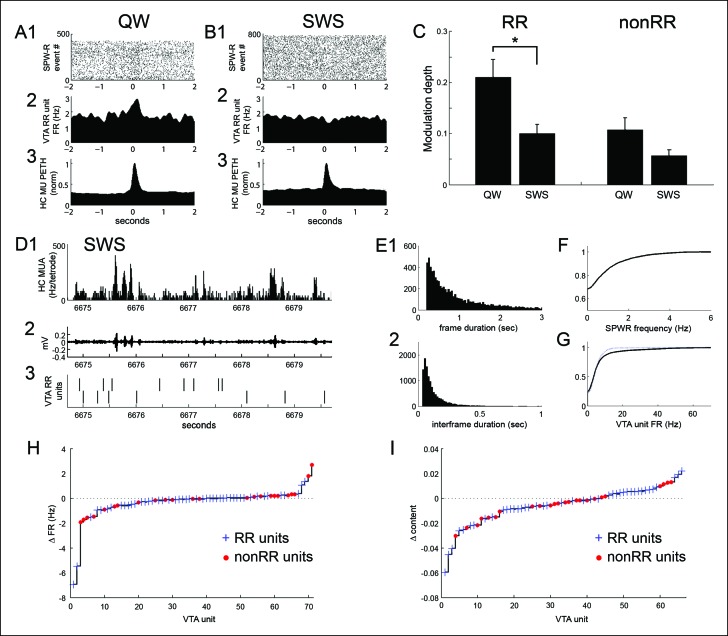
Figure 7. SPW-R-associated modulation of VTA units during periods of quiet wakefulness (QW) on the task and during subsequent slow wave sleep (SWS).
(A) Rastered QW-associated reward responsive (RR) VTA unit spikes (1) and RR unit and hippocampal (HC) multiunit PETHs (2,3), aligned to SPW-R events. (B) SWS-associated data for the same RR unit. (C) SPW-R event modulation depth of RR and nonRR unit activity in QW and SWS (RR units: QW vs SWS, p=0.003, rank-sum test; nonRR units: QW vs SWS, p=0.13, rank-sum test). Error bars represent s.e.m. (D1) Hippocampal multiunit activity, (2) ripple band, and (3) two RR VTA units in SWS. (E) Distributions of (1) SWS frame duration and (2) interframe duration across recordings. (F) Cumulative distribution of within-frame SPW-R frequency. (G) Within-frame VTA unit activity. RR units are shown separately in dashed line. (H) The difference in each VTA unit’s activity at frames of high and low SPW-R rate, defined relative to the mean (RR units: p=0.003, signed-rank test; nonRR units: p=0.5). (I) The difference in mean spatial content of frames with high and low VTA unit activity, relative to the mean (RR units: p=0.045, signed-rank test).

