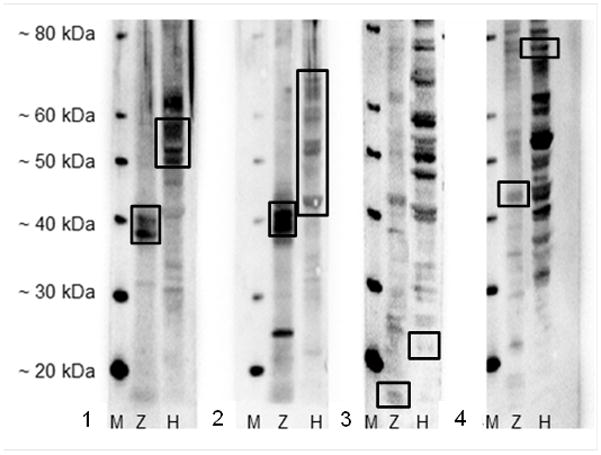
Fig. 1.

Western blot against (a) WSS compared to expected targeted protein sizes (indicated by box) where M=marker protein, Z=normal whole adult zebrafish tissue homogenate, H=HTP-1 cells (human), (b) AE1/AE3 compared to expected targeted protein sizes, (c) S100 compared to expected targeted protein size, and (d) chromogranin A compared to expected targeted protein size.
